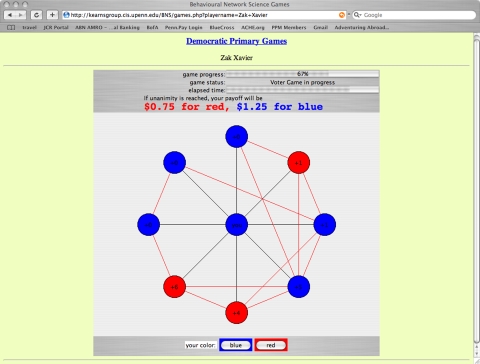
Fig. 1.
Screenshot of the user interface for a typical experiment. Each subject sees only a local (“ego network”) view of the global 36-vertex network, showing their own vertex at the center and their immediate neighbors surrounding. Edges between connected neighbors are also shown, as are integers denoting how many unseen neighbors each neighbor has. Vertex colors are the current color choices of the corresponding subjects, which can be changed at any time using the buttons at the bottom. The subject's payoffs for the experiment are shown (in this case $0.75 for global red consensus, $1.25 for blue), and simple bars show the elapsed time in the experiment and the “game progress,” a simple global quantity measuring the fraction of edges in the network with the same color on each end. This progress bar is primarily intended to make subjects aware that there is activity elsewhere in the network to promote attention, and is uninformative regarding the current majority choice.

