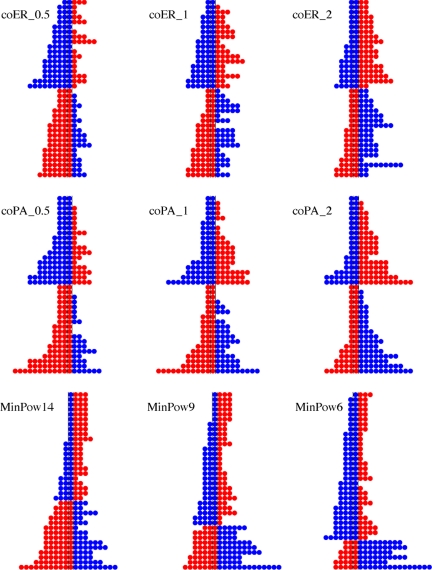
Fig. 2.
Visualization of network and incentive structures. For each of the 9 network and incentive structures there is a diagram consisting of 36 rows of colored dots. Each row corresponds to a single subject or vertex in the network, and the dots in that row represent that subject and his or her network neighbors. The color of the central dot indicates the preferred (higher payoff) color for the corresponding subject, according to the incentives. The dots to the left of center indicate the number of neighboring subjects with the same preference; the dots to the right indicate the number with the opposite preference. Vertices are ordered within groups by their overall degree. (Top) Cohesion experiments with Erdos–Renyi connectivity in which there is more intra- than inter-group connectivity between the two groups (specifically a 1:2 inter:intra ratio) (Left); balanced connectivity (1:1 ratio) (Center); and more inter- than intra-group connectivity (2:1 inter:intra ratio) (Right). This is demonstrated by the migration of dots from left of center to right of center as we move from column 1 to 2 to 3. (Middle) Cohesion experiments with preferential attachment connectivity in the same inter:intra ratios as the coER row above. Comparison with the first row reveals clear differences in the overall degree distributions, because the variance in the total number of neighbors of subjects is much higher for preferential attachment and those diagrams reveal the presence of subjects with very large numbers of neighbors. (Bottom) Minority Power experiments, where again we see the heavy-tailed degree distributions typical of preferential attachment but in which now the blue-preferring vertices are selected to be a minority of varying sizes (14, 9, and 6) with the highest degrees. As discussed in the text, each of these 9 network structures was combined with payoff amounts that were weak symmetric, strong symmetric and asymmetric, yielding 27 distinct scenarios that were each executed in 3 trials, for a total of 81 experiments.

