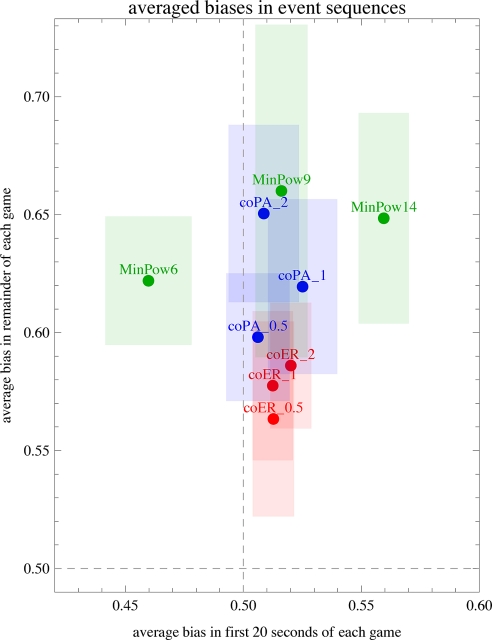
Fig. 4.
Visualization of biased random-walk model fits to the dynamics of Fig. 3. For each of the 81 individual experimental plots in Fig. 3, we fit a 2-segment random walk model to the data—one segment for the first 20 s of the experiment, and one for the remainder of the experiment (similar findings result from different cut points between the two segments). Within each segment, we simply compute the fraction p of “upwards” moves (the number of moves toward the eventual majority color, divided by the total number of moves within the segment). This can be interpreted as modeling the collective dynamics by a random walk with probabilities p and 1 − p of upwards and downward moves, respectively; we refer to p as the bias of the model. Permitting independent bias values in the two segments allows us to separately model the dynamics in the early and later portions of each experiment. This yields a 2-parameter model for each of the 81 plots. Above we show the result of averaging over all incentive schemes and all repeated trials within the 9 families of network structures (Cohesion with Erdos–Renyi connectivity and 3 settings of inter- vs. intra-group connectivity; Cohesion with preferential attachment connectivity in 3 inter- vs. intra- settings; and Minority Power with 3 different minority group sizes). For each of these 9 families, we plot a point showing the average bias in the two segments, along with a shaded rectangle delimiting the standard deviation in both bias parameters for that family. The dashed lines show p = 0.5, where the model is unbiased (equal upward and downward probability). Several qualitative effects of network structure are apparent. For instance, Cohesion experiments tend to begin slowly (bias only slightly larger than 0.5), but preferential attachment connectivity leads to more rapid convergence in the later portion than does Erdos–Renyi connectivity. Increasing inter-group connectivity speeds the later dynamics regardless of the connectivity type. Minority Power experiments tend to conclude rapidly, but their early dynamics are strongly dependent on the minority size, with smaller minorities slowing the early progress toward the eventual majority choice. When the minority size is only 6, the first 20 seconds typically have a downward drift (bias p < 0.5).

