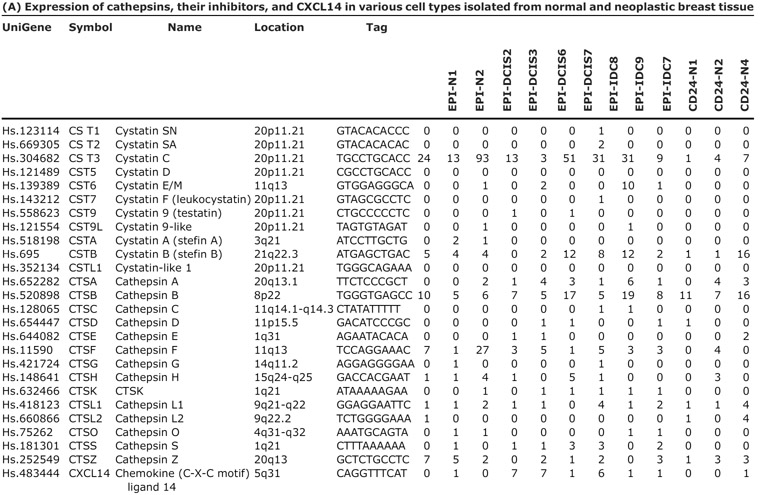
Table 3.
Cathepsins and their inhibitors
 |
| (B) Summary of results of growth inhibition assays with various cathepsin inhibitors
| |||
|---|---|---|---|
| Cell line | CTSB inhibitor | CTSL inhibitor | CTSK inhibitor (A and B) |
| BT-549 | Inhibition of growth at 20 μmol/L | No response | ND |
| MDA-MB-231 | Inhibition of growth at 20 μmol/L | No response | ND |
| MDA-MB-435 | Inhibition of growth at 20 μmol/L | Morphologic changes at 10 μL | ND |
| MCF10DCIS | Inhibition of growth at 20 μmol/L | No response | No response |
| MCF10DCIS+stroma | Inhibition of growth at 20 μmol/L | No response | No response |
NOTE: (A) Gene names and symbols, serial analysis of gene expression tag numbers (normalized to 50,000) and sequence, UniGene IDs, and chromosomal location are indicated. CD24, CD44, and MUC1 refer to cells purified using these cell surface markers. (B) Cells, inhibitor used, concentration, and results are indicated.
Abbreviations: N, normal; D, DCIS; I, invasive; EPI, epithelial cells; MYOEPI, myoepithelial cells; MYOFIB, myofibroblasts; STR, stromal fibroblasts; ND, not determined.
