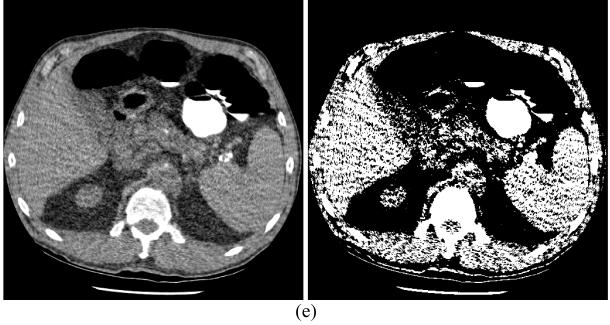
Figure 5.
Illustration of two different window displays of the reconstructed images of Figure 4: (a) from the normal dose scan; (b) from the standard FBP reconstruction of the re-projected normal dose projection data; (c) from the standard FBP reconstruction of the simulated ultra low-dose projection data; (d) from the conventional FBP reconstruction of the simulated ultra low-dose projection data, where the Hanning filter had an optimized cutoff at 80% Nyquist frequency; and (e) from the standard FBP reconstruction of the simulated ultra low-dose projection data after KL-PWLS sinogram noise reduction was applied. Left column shows the displays at window setting of 40/400 HU (this is the default window setting for pelvic CT images in clinic). Right column shows the displays at window setting of 35/10 HU (i.e., displays at a narrower window).


