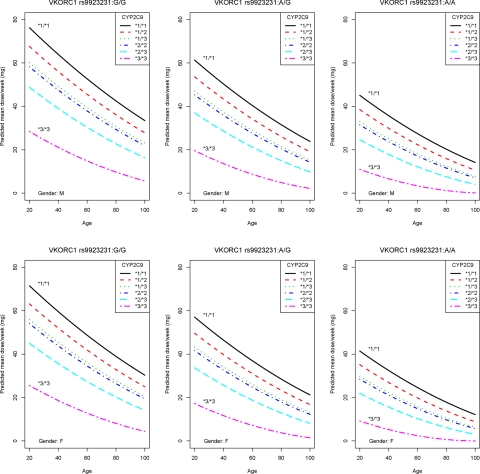
Figure 2.
The dose algorithm illustrated by nomograms. The nomograms show predicted maintenance dose for VKORC1 and CYP2C9 genotypes, sexes, and ages with the number of interacting drugs increasing warfarin effect set as 0, hence they do not account for drug interactions (Table 3).

