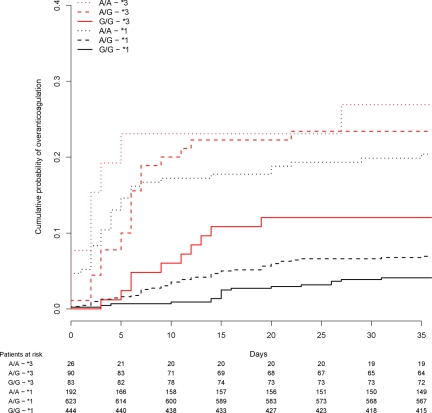
Figure 4.
Survival (Kaplan-Meier) curve showing time to first INR peak greater than 4. VKORC1 rs9923231 (−1639 G>A) and CYP2C9*3 are presented. *3 indicates a carrier of at least 1 CYP2C9*3 allele, while *1 in this case means that *3 is not present. The table beneath the graph shows the number of individuals that had not reached INR > 4 at certain time points.

