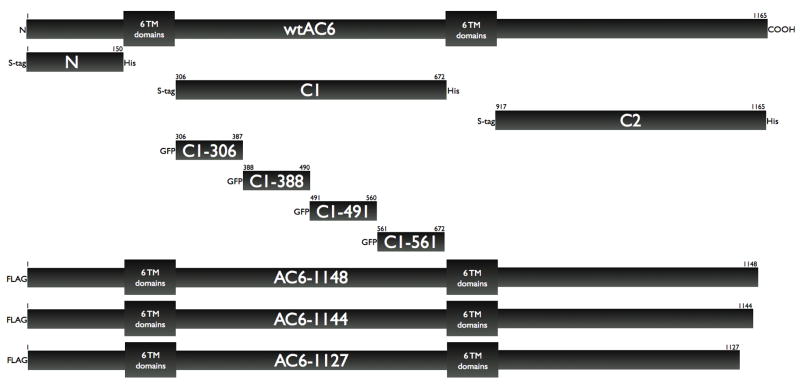
Figure 3. Schematic diagram of AC6 fragments and truncated proteins constructed for these studies.
Wild type (full length) AC6 is represented by the top bar, with each of the two cassettes of 6-transmembrane domains represented by boxes for simplicity. Each bar below represents the individual proteins constructed and expressed in this study, with their designation and various epitope tags shown. The scale of these bars is representative only

