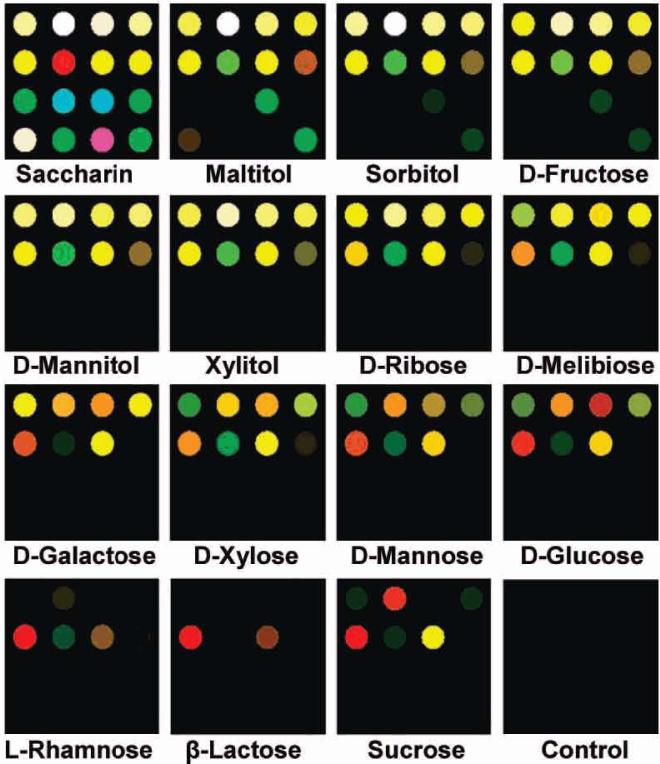
Figure 3.
Color difference maps of 15 sugars and sweeteners after equilibration at 25 mM concentration, except for sucrose (150 mM). For visualization, the color range is expanded from 4 to 8 bits per color (RGB range of 4-19 expanded to 0-255), except for β-lactose, sucrose, and the control (4-7 to 0-255) due to low response. For all statistical analysis, the complete raw digital data (Supporting Information Table S3) were used.

