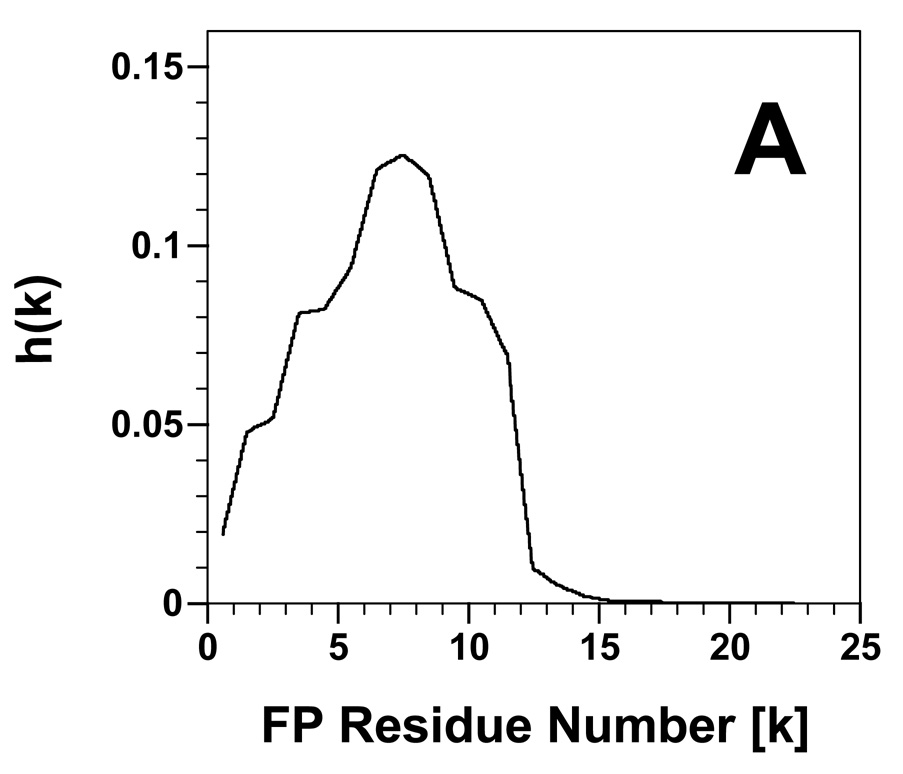
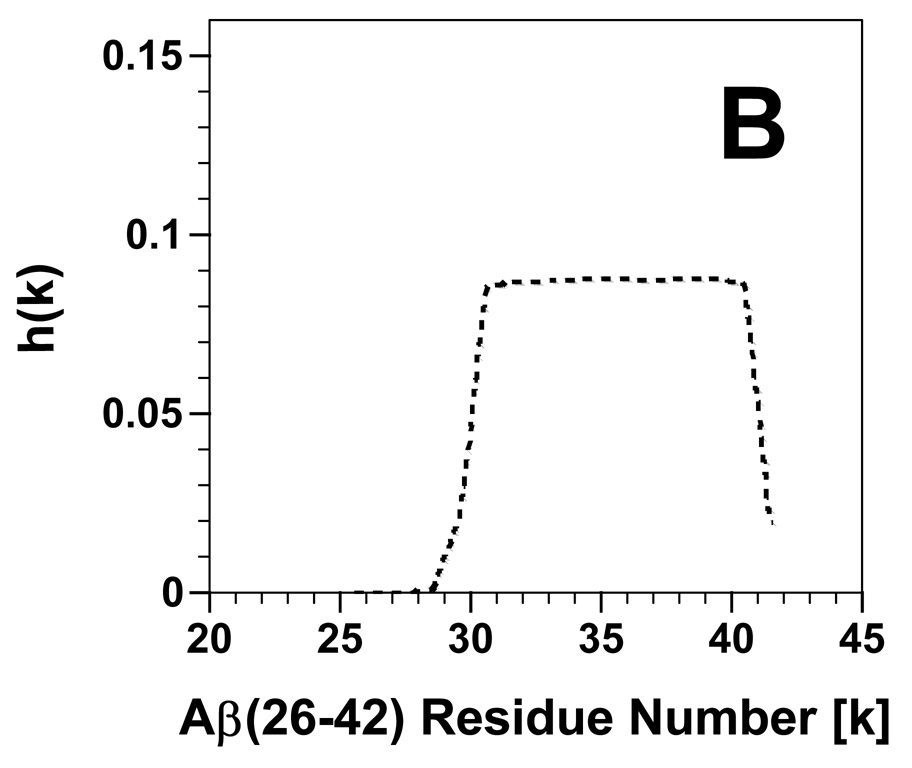
fig. 5.
Propensity for β-sheet aggregation [i.e., h(k)] plots determined for FP (A) and Aβ(26–42) (B) from PASTA analyses [36,37]. The h(k) values are plotted for each peptide residue (k), and normalized so that the summation of all h(k)s for a peptide equals 1.0. The sequence and numbering for FP and Aβ(26–42) are in Fig. 1.


