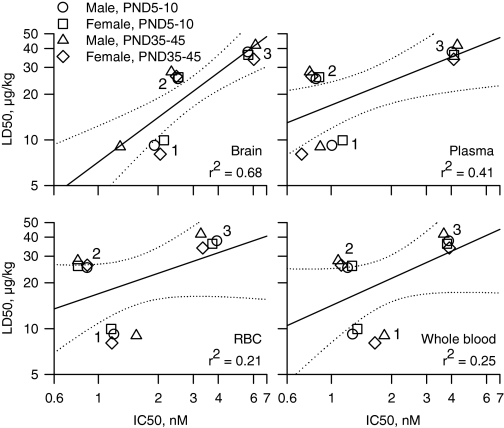
Fig. 6.
Correlational analysis of the relationship between LD50 values and IC50 values for in vitro inhibition of AChE in various tissues from neonatal and prepubertal guinea pigs of both sexes. Double logarithmic plots of the median lethal doses (LD50 values) of each nerve agent for neonatal and prepubertal guinea pigs of both sexes versus the corresponding in vitro concentrations of the nerve agents needed to inhibit by 50% the AChE activity in brain extracts, plasma, RBCs, or whole blood. The symbol clusters labeled 1, 2, and 3 correspond to VX, soman, and sarin, respectively. In each graph, the solid lines represent the linear regression of the data points, and the dotted lines illustrate the 95% confidence intervals of the regression. The Pearson coefficients (r2) are shown at the bottom right of each graph. LD50 values for prepubertal male guinea pigs are from the literature (Shih and McDonough, 2000).

