
Figure 1. Analysis of NsrR::FLAG extract and functionality in vivo.
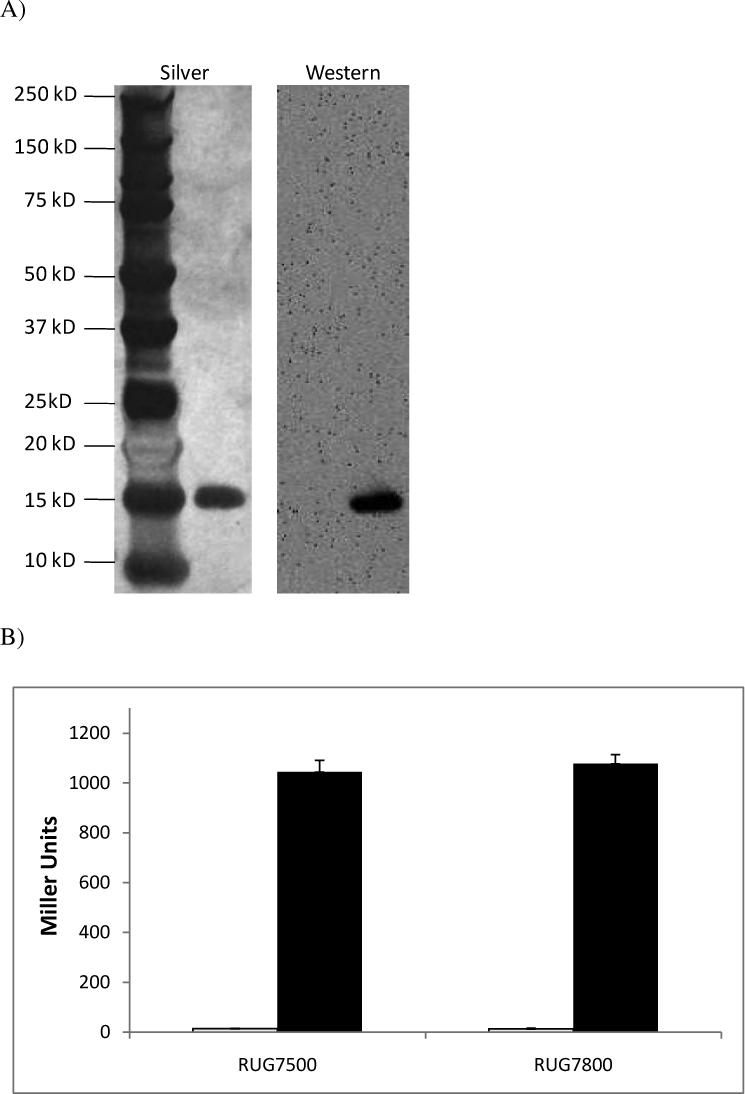

(A) Affinity purified NsrR::FLAG was analyzed by SDS-PAGE and silver stained (left) or probed with M2 antibody in Western blot analysis (right). (B) Wild type (RUG7500) and nsrR::FLAG expressing (RUG7800) gonococcal norB::lacZ reporter fusion strains were grown aerobically (white bars) and anaerobically with nitrite (black bars), and ß–galactosidase activity was measured. These data are the mean of 6 determinations ± one SD. (C) Mass spectrum of undigested NsrR::FLAG in linear positive ion mode. 1800 laser shots were summed to obtain this spectrum. The observed mass peak is equal to the predicted mass of the protein plus the mass of a [2Fe-2S] cluster.