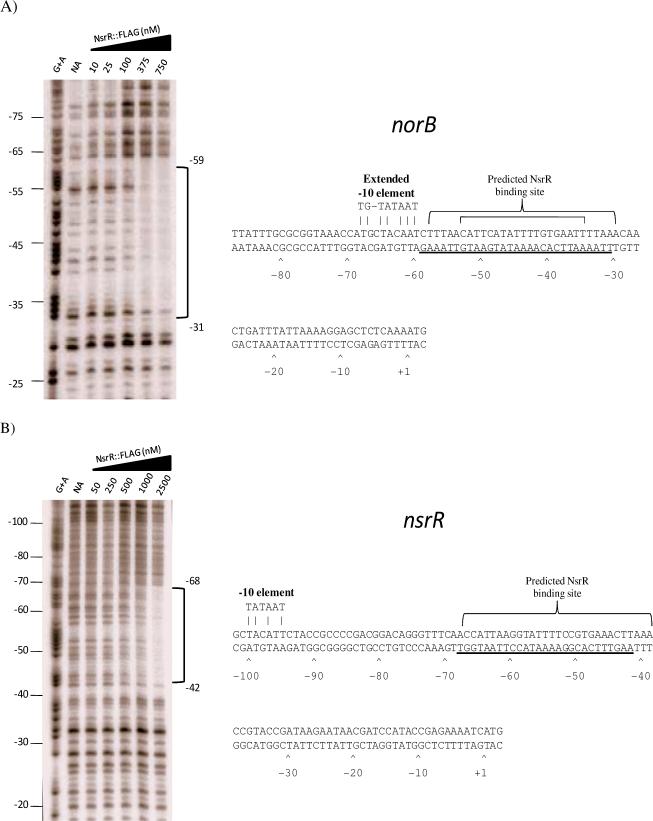
Figure 4. DNaseI footprint analysis of the norB and nsrR upstream regions.
(A) A DNaseI footprint was generated from a radiolabeled fragment of the norB upstream region using increasing concentrations of NsrR::FLAG. Binding by NsrR::FLAG was shown to protect nucleotides −31 through −59 relative to the translational start site. In the sequence data, the large bracket above the sequence represent nucleotides that make up the predicted NsrR binding site (Isabella et al., 2008), and the small bracket makes up the consensus predicted by Rodionov et al. (2005). Underlined bases represent nucleotides protected from DNaseI digestion. (B) DNaseI footprint analysis of the nsrR upstream region using increasing concentrations of NsrR::FLAG. Protein binding was shown to protect nucleotides −42 through −68 relative to the translational start site. Brackets above the sequence show the predicted NsrR binding site. Underlined bases represent nucleotides protected from DNaseI digestion. (NA) No addition.

