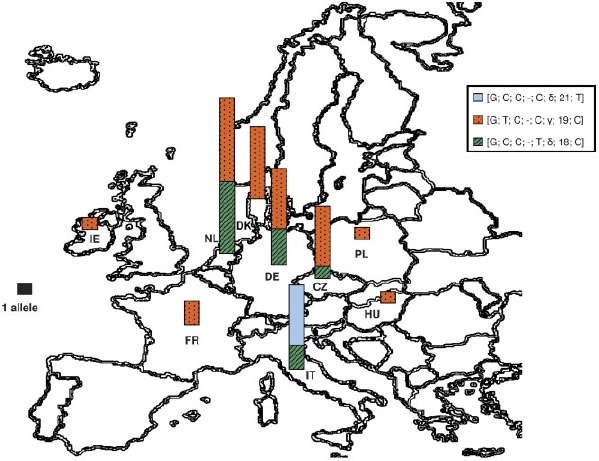
FIGURE 2.

Distribution of c.[833C; –] haplotypes in Europe.Three different pathogenic haplotypes ([G; C; C; –; C; δ; 21;T], [G; C; C; –;T; δ; 18; C], and [G; T; C; –; C; γ; 19; C]) were observed among European homocystinuria patients. Haplotypes are described in relation to the reference CBS haplotype, for details see Patients and Methods. The number of chromosomes is proportional to the size of the column in each country, normalized by the black square representing one allele; it may also be found in Supplementary Table S3. [Color figure can be viewed in the online issue, which is available at www.interscience.wiley.com.]
