
Figure 3. Expression of pluripotency factors in Eednull ES cells.
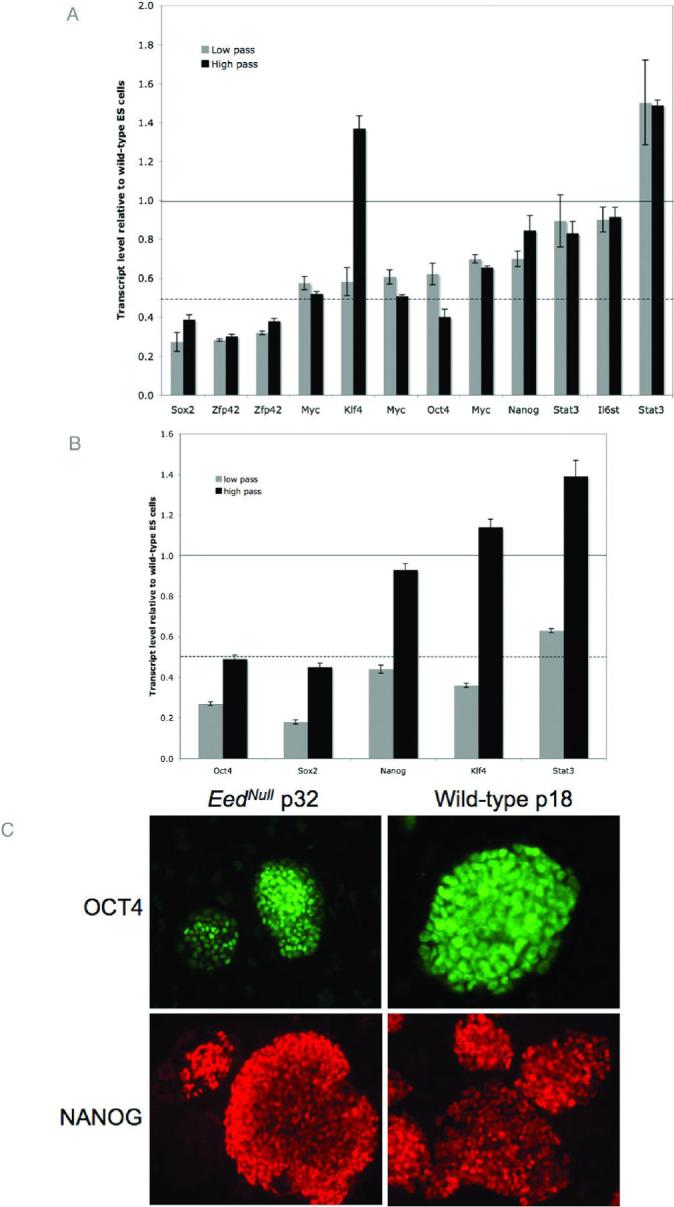
Multiple listings for the same gene indicate independent transcripts represented on the microarray and may represent alternate splice forms. Horizontal black lines indicate a value of 1, where mutant and wild-type ES cells have the same expression levels. Dashed black lines represent a value of 0.5, where mutant cells have half of the expression level as wild-type counterparts. (A.) The relative expression levels of several pluripotency markers in low (gray bars) and high (black bars) pass Eednull ES cells was determined by microarray analysis. While most factors have lower expression levels than wild-type ES cells, gene expression is maintained. With the exception of Klf4, low and high pass mutant cells have similar expression levels. Error bars indicate standard error calculated from 3 technical replicates. (B.) Real-time RT-PCR verification of selected genes represented in panel A shows that expression levels are reproducible. Real-time RT-PCR was carried out in duplicate on RNA generated from pooled cell samples (3 different samples per pool). Error bars represent standard error from 2 replicate pools. (C.) Wild-type and high pass Eednull ES cells were stained with antibodies against OCT4 and NANOG. Robust staining for is observed for both factors. Corresponding DAPI images are found in Figure S2.