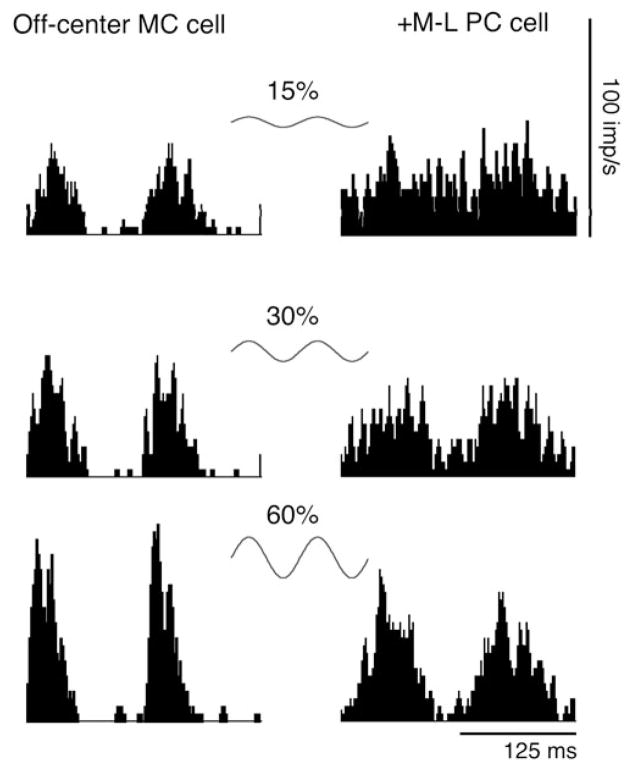
Fig. 3.
Histograms for a typical MC cell’s responses to luminance gratings and a typical PC cell’s responses to chromatic gratings at three contrast levels (15% to 60% luminance contrast or 3% to 12% M-cone contrast). All gratings are drifted at 8 Hz. MC cell responses show phase advance as contrast increases, while PC cell responses show little phase change as contrast increases.

