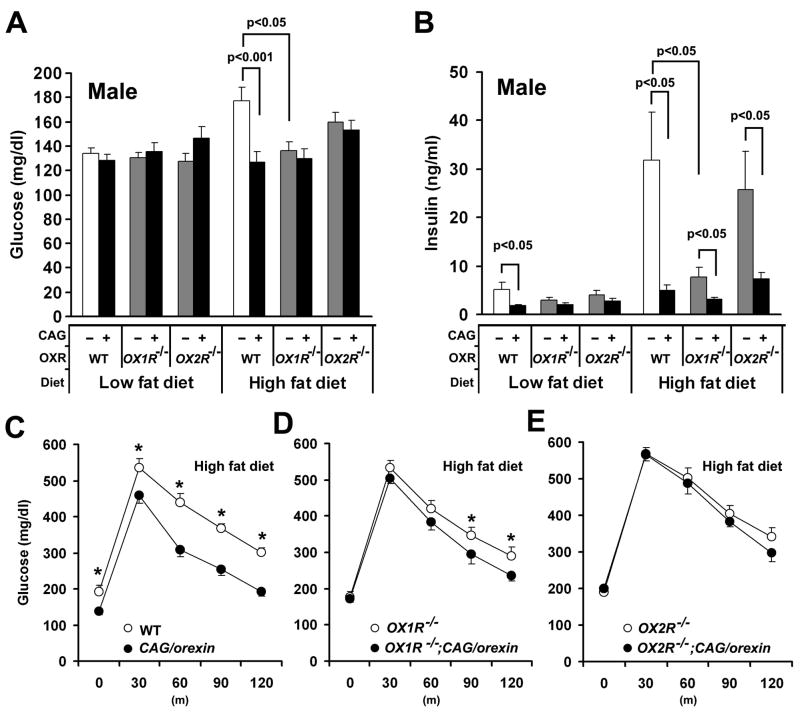
Figure 4. Glucose metabolism of orexin signaling-modified mice on different fat diets.
(A) Blood glucose levels of orexin-related gene mutant mice on different fat diets.
(B) Serum insulin levels of orexin-related gene mutant mice on different fat diets.
(C) Glucose tolerance test showed that the blood glucose levels of CAG/orexin mice were significantly lower than those of wild-type littermate mice on a high fat diet after the administration of glucose.
(D) Glucose tolerance test showed that the blood glucose levels of OX1R−/−; CAG/orexin mice were significantly lower than those of OX1R−/− mice on a high fat diet after the administration of glucose. Data are expressed as means ± SEM.
(E) Glucose tolerance test showed that there is no significant difference in the blood glucose levels between OX2R−/−; CAG/orexin mice and OX2R−/− mice on a high fat diet after the administration of glucose (p=0.33).
The numbers of mice are 8–14 mice and 6–10 mice per group for blood glucose and insulin measurement, and glucose tolerance test, respectively. Data are expressed as means ± SEM. *p<0.05

