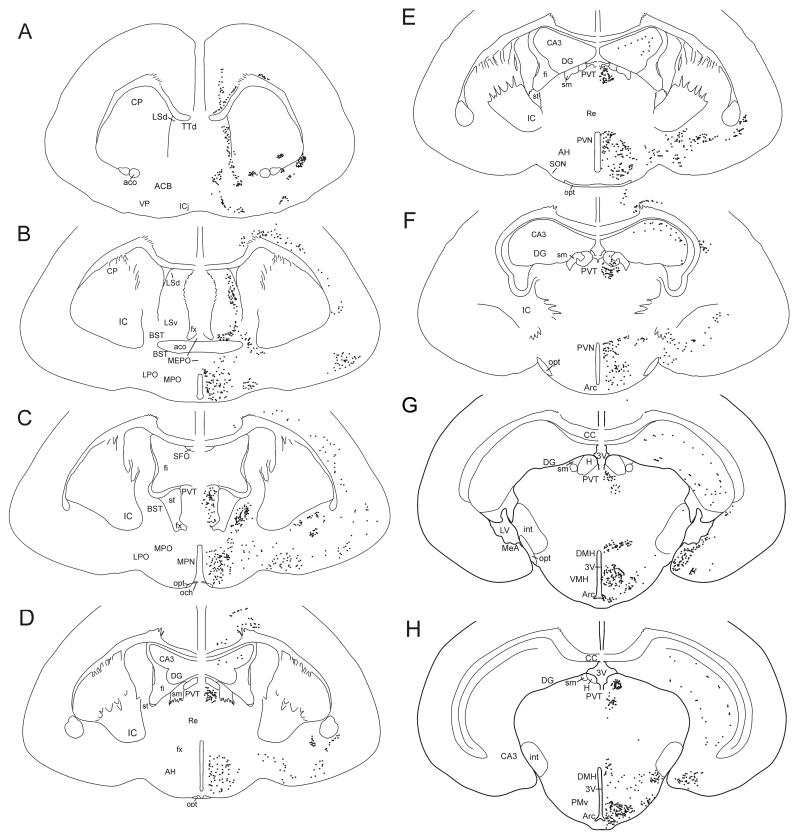
Figure 1.
Camera lucida drawings of frontal sections through the forebrain of the naked mole-rat showing the distribution of AR+ cells (black dots). (A) through (H) represent sequentially more caudal sections. Neuronal structures are indicated on the left, and the location of AR+ cells on the right. The number of dots represents relative density of immunoreactivity. 3V, third ventricle; Aco, anterior commissure; ACB, nucleus accumbens; AH, anterior hypothalamus; Arc, arcuate; BST, bed nucleus of the stria terminalis; CA3, field CA3 Ammon’s horn; CC, corpus callosum; CP, caudate putamen; DG, dentate gyrus; DMH, dorsomedial nucleus of the hypothalamus; fi, septal fimbria; fx, fornix; H, habenula; IC, inferior colliculus; ICj, islands of Calleja; int, internal capsule; LPO, lateral preoptic area; LSd, dorsal lateral septum; LSv, ventral lateral septum; LV, lateral ventricle; MeA, medial nucleus of the amygdala; MEPO, median preoptic nucleus; MPN, medial preoptic nucleus; MPO, medial preoptic area; och, optic chiasm; opt, optic tract; PMv, ventral portion of the premammillary nucleus; PVN, paraventricular nucleus of the hypothalamus; PVT, paraventricular nucleus of the thalamus; TTd, tenia tecta, dorsal part; Re, nucleus reuniens; SFO, subfornical organ; sm, stria medullaris; SON, supraoptic nucleus; st, stria terminalis; VMH, ventromedial hypothalamus; VP, ventral pallidum.

