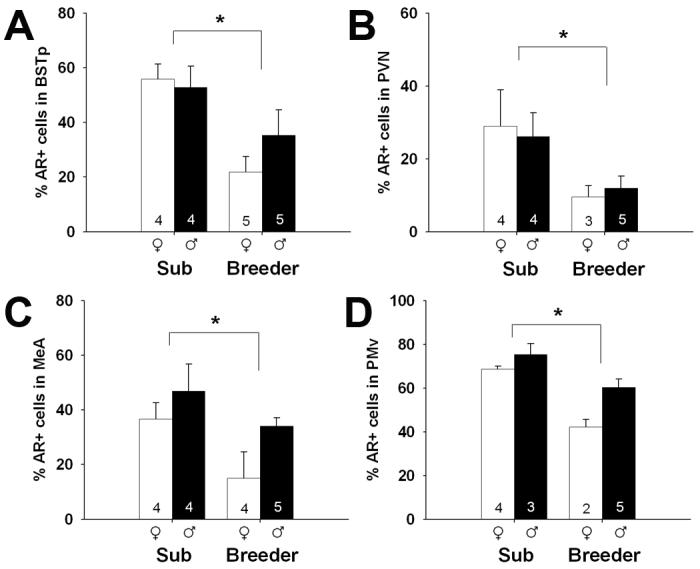
Figure 4.

Mean (+/- SEM) percentage of AR+ cells in the BST (A), PVN (B), MeA (C), and PMv (D) of subordinate (Sub) and breeding naked mole-rats. Number of animals per group is noted at the base of each bar. White bars represent females and black bars represent males. Asterisks indicate significant main effects of social status: p = 0.004 (A), p = 0.028 (B), p = 0.016 (C), and p = 0.001 (D). A main effect of sex (favoring males) was also detected in the MeA and PMv. No status by sex interactions were detected on any measure.
