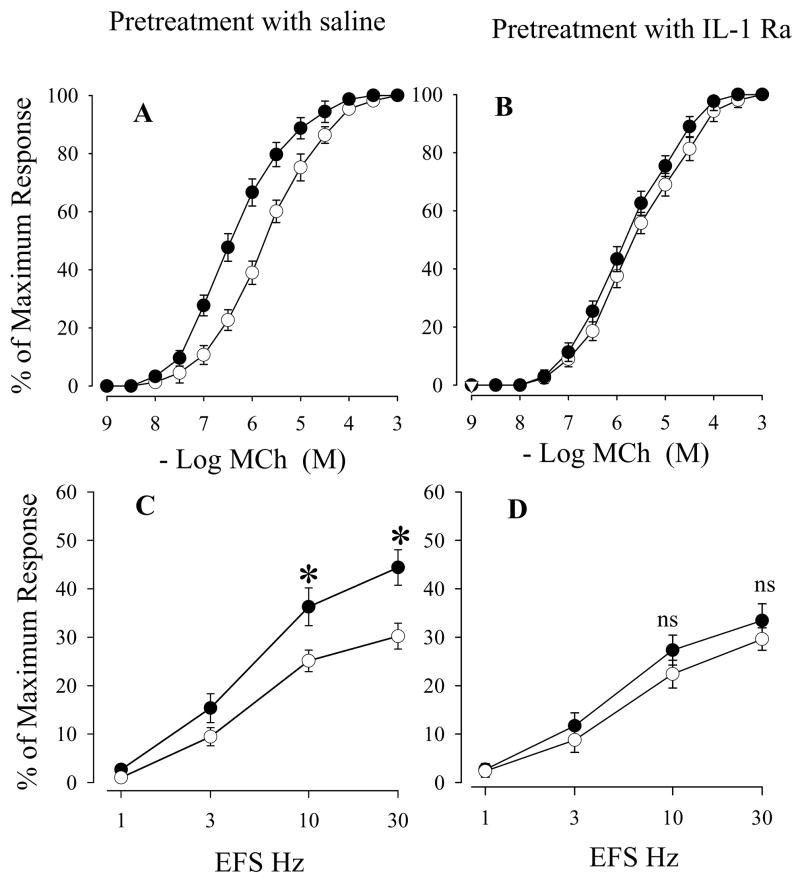
Figure 5.
Effects of saline (A and C) or IL-1 receptor antagonist (B and D) on cumulative concentration-response curves for MCh (A and B) and frequency-response curves for EFS (C and D) in organotypic cultured tracheal smooth muscle after in vitro exposure to air (○) or ozone (●). Values are means ± SE; n = 5. The difference in MCh cumulative concentration-response curves between air and ozone in vitro exposure are presented in Table 3 *Significant difference in EFS between in vitro air and ozone exposure, P ≤0.05.

