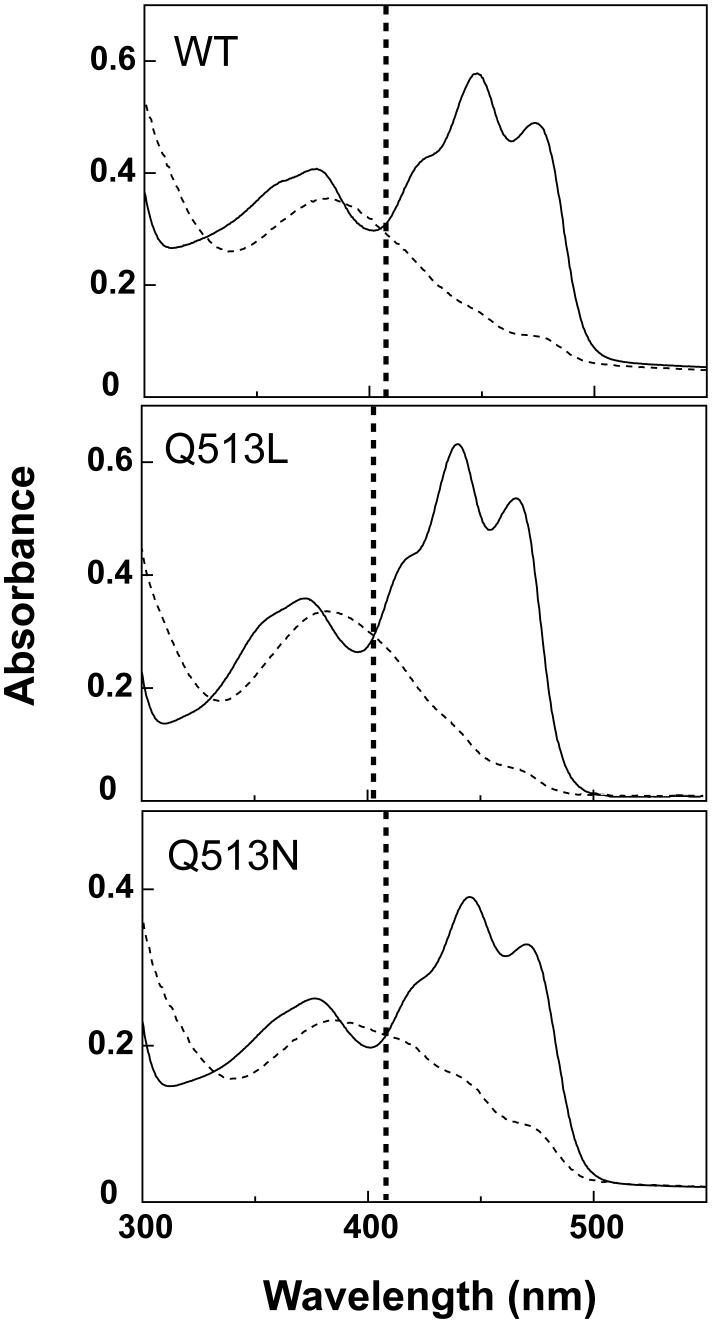
Figure 2. UV-visible absorbance profiles of AsLOV2 wildtype protein and Q513 mutants.
Solid traces represent the dark state spectra and dashed traces represent the lit state spectra. The mutants all display the same characteristic dark state absorbance profile for typical LOV domains, with three distinctive maxima between 400 nm to 500 nm. These maxima diminish in the lit state in all three cases. The vertical dashed line is aligned with the largest wavelength isosbestic points of the LOV domains (406 nm for AsLOV2 and Q513N; 403 nm for Q513L).

