Figure 2.
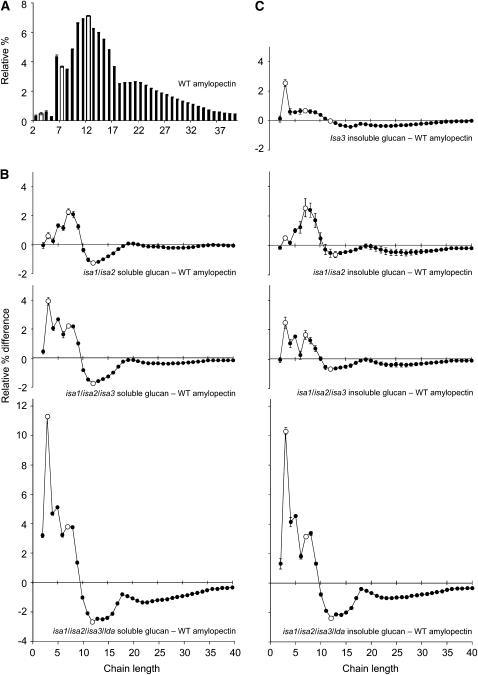
Changes in the Chain Length Distributions of Glucans Extracted from Leaves of the DBE Mutant Combinations.
Glucans extracted from individual plants harvested at the end of the day (phytoglycogen precipitated from the soluble extracts and total insoluble glucans) were pooled such that each plant contributed an equal amount of glucan. The resultant samples were debranched with Pseudomonas isoamylase and Klebsiella pullulanase and analyzed by HPAEC-PAD. Peak areas were summed, and the areas of individual peaks were calculated as a percentage of the total ± se of three technical replicates. The difference plots for each of the mutant glucans shown were derived by subtracting the relative percentage values of wild-type amylopectin. For ease of comparison, open symbols are placed at d.p. 3, 7, and 12. The se values of the compared data sets were added together. Additional data in Supplemental Figure 6 online show the equivalence between the glucans in isa1/isa3, isa2/isa3, and isa1/isa2/isa3 and between isa1/isa3/lda, isa2/isa3/lda, and isa1/isa2/isa3/lda.
(A) Chain length distribution of wild-type amylopectin.
(B) The difference between the chain length distributions of the soluble glucans from the DBE mutant combinations (as indicated) and wild-type amylopectin shown in (A).
(C) The difference between the chain length distributions of the insoluble glucans from the DBE mutant combinations (as indicated) and wild-type amylopectin shown in (A).

