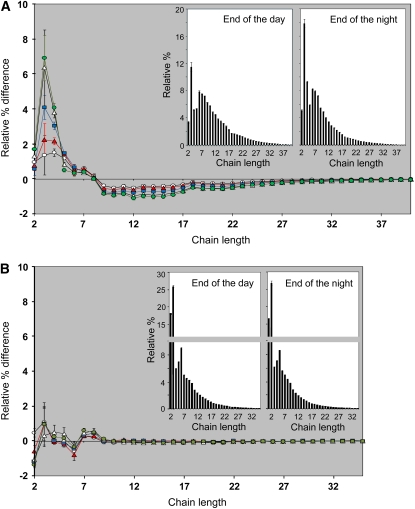
Figure 7.
Comparisons of the Chain Length Distributions and the β-Limit Chain Length Distributions of Phytoglycogen from Leaves of the Quadruple DBE Mutant Harvested at Different Times of the Diurnal Cycle.
Phytoglycogen was prepared, debranched, and analyzed as in Figure 2 either without (A) or with (B) pretreatment with β-amylase. HPAEC-PAD peak areas were summed, and the areas of individual peaks were expressed as percentages of the total. The means ± se of three technical replicate digests are shown.
(A) Difference plots derived by subtracting the relative percentage values of the quadruple DBE mutant phytoglycogen extracted at the end of the day from those obtained after 1 h (white circles), 2 h (red triangles), 4 h (blue squares), 8 h (white triangles), and 12 h (green circles) of the night. The se values of the compared data sets were added together. Note the progressive increase in the relative abundance of short chains during the first 8 h of the night. Chain length distributions of phytoglycogen from the end of the day and the end of the night are shown in the insets.
(B) Difference plots derived by subtracting the relative percentage values of the quadruple DBE mutant β-limit phytoglycogen extracted at the end of the day from those obtained after 1 h (white circles), 2 h (red triangles), 4 h (blue squares), 8 h (white triangles), and 12 h (green circles) of the night. The se values of the compared data sets were added together. Chain length distributions of β-limit phytoglycogen from the end of the day and the end of the night are shown in the insets. Note the change in the scale of the y axis.

