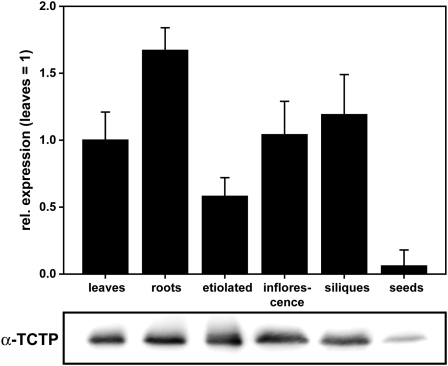
Figure 2.
Transcript and Protein Expression Analysis.
Expression of TCTP was analyzed at the transcript level by qRT-PCR (top panel, mRNA expression levels relative to leaves and first normalized against reference genes, three biological replicates, given as means ± se; see Methods) and on the protein level by immunoblotting with a polyclonal antibody to At3g16640 TCTP protein (bottom panel, 10 μg protein loaded per lane; for TCTP antiserum specificity, see Figure 5). Differences in gene expression levels among tissues (leaves and roots: 2-week-old plants grown in plates; etiolated: grown in plates for 5 d in the dark; inflorescence: fully open flowers stage 12; siliques: fully developed green siliques, seed: mature dry seeds) were below twofold except for mature seeds that had 10-fold lower transcript levels than leaves. Protein levels (same tissues as above) rank according to mRNA levels.

