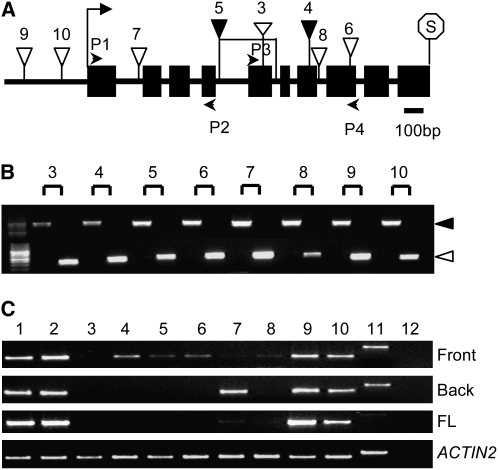
Figure 2.
Gene Structure and T-DNA Insertion Analyses of PDIL2-1.
(A) PDIL2-1 gene structure and T-DNA insertion sites. P1, P2, P3, and P4 indicate position of primers used to check expression. Start and stop codons are noted with an arrow and octagon, respectively. Black boxes and black lines represent exons and introns, respectively.
(B) PCR identification of homozygotes in the indicated T-DNA insertion lines. For each line, the left lane is a wild-type plant having only a gene-specific band (black arrow), and the right lane is an insertion line, having only a T-DNA–specific band (white arrow).
(C) RT-PCR analyses. PDIL2-1 expression was examined using primers covering different parts of the gene (primers P1 and P2, front; or primers P3 and P4, back) or full-length (FL) cDNA. ACTIN2 expression was used as a control.
The numbers shown in (A) to (C) represent (1) Ws4 wild type, (2) Col-0 wild type, (3) FLAG_015D01, (4) FLAG_427G04, (5) SALK_046705, (6) SALK_082179, (7) SALK_135268c, (8) SALK_148421, (9) SALK_097094, (10) CS859015, (11) gDNA control, and (12) water control.

