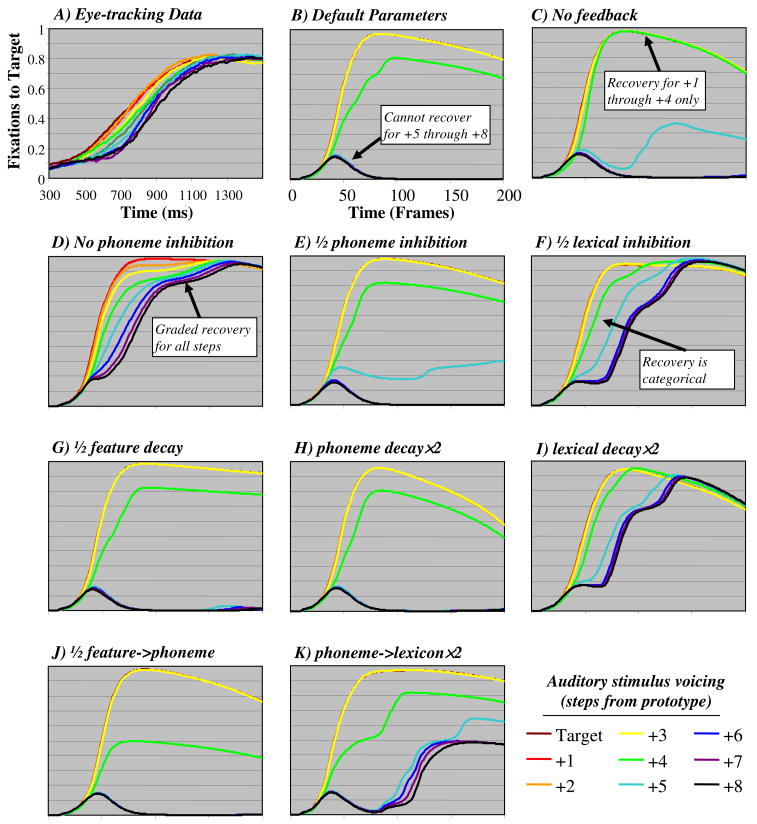
Figure 7.
Predicted fixations as a function of time for TRACE simulations of Experiment 1. Each panel represents a single variant of one parameter. All panels have identical X and Y axes—labels were left off for visual clarity. See Appendix A for the specific parameter values.

