Fig. 2.

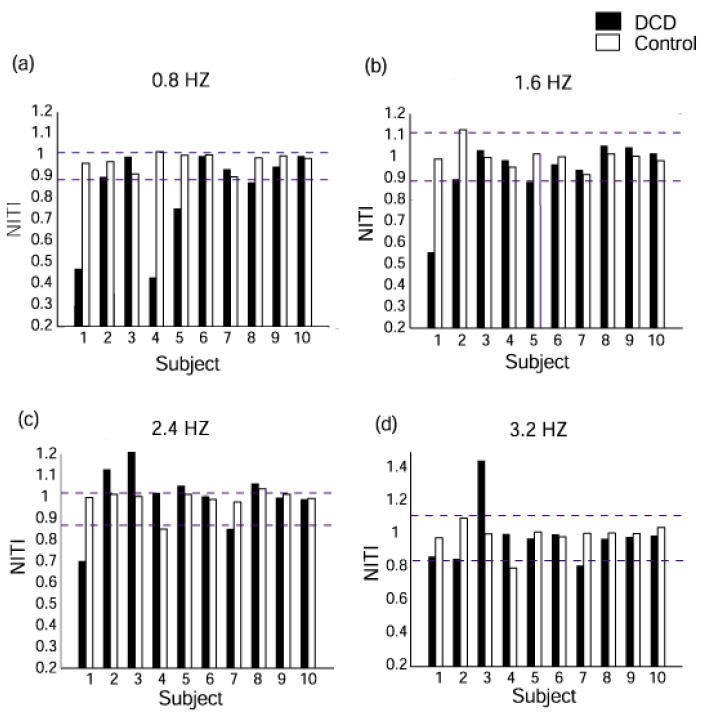
Individual comparison between children with DCD and their matched controls on NITI at different frequency conditions: (a) 0.8 Hz (b) 1.6 Hz (c) 2.4 Hz (d) 3.2 Hz. Dashed lines represent +/- 2 SD around the mean of the TD children.

Individual comparison between children with DCD and their matched controls on NITI at different frequency conditions: (a) 0.8 Hz (b) 1.6 Hz (c) 2.4 Hz (d) 3.2 Hz. Dashed lines represent +/- 2 SD around the mean of the TD children.