
Fig. 4.
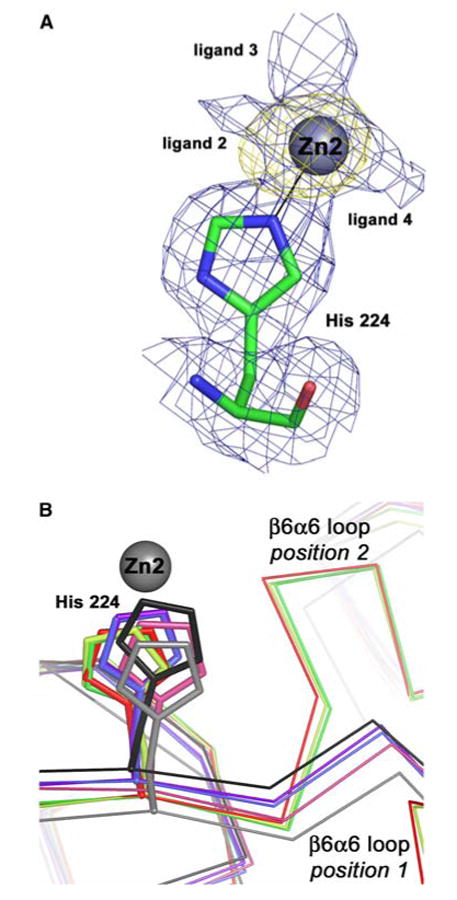
The second metal binding site in Eco-ZnuA. a Final 2.0-Å resolution 2Fo – Fc electron density map (blue, contoured at 0.7σ) superimposed on the anomalous difference Fourier map calculated using data collected near the zinc absorption edge (yellow, contoured at 5σ). The unidentified ligands are labeled ligand 2, ligand 3, and ligand 4. b Superposition of all the His224 residues with ZnZnuA molecules A, B, C, and D shown in green, light green, red, and dark salmon, respectively, CoZnuA molecules E and F shown in blue and light blue, respectively, and apoZnuA molecules G and H shown in gray and black, respectively. The two different positions of the β6α6 loop are clear