
Fig. 9.
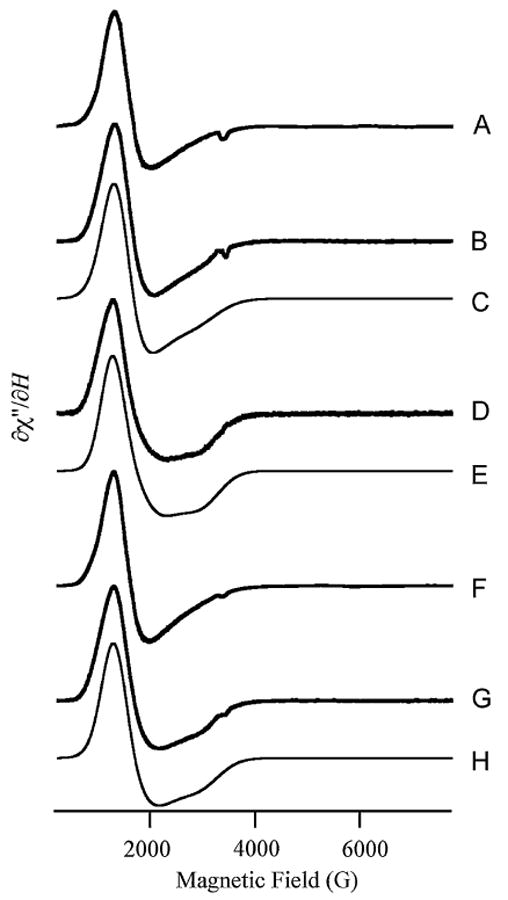
Electron paramagnetic resonance (EPR) spectra of CoZnuA. Traces A, B, F, and G are experimental EPR spectra of ZnuA with 1 equiv of Co2+ (A, B) or 2 equiv of Co2+ (F, G). Spectra A and F were recorded at 5 K, 50-mW microwave power, and spectra B and G were recorded at 13 K, 2-mW microwave power. Spectra F and G are shown with twofold reduced amplitude compared to spectra A and B, respectively. Trace D is the difference spectrum obtained by subtraction of trace B from trace G (prior to amplitude reduction of trace G). Trace C is a simulation of trace B assuming a spin Hamiltonian H = βg·B·S + S·D·S, where S = 3/2, and parameters D = 50 cm−1 (i.e., D ≫ gβBS, MS = |±1/2〉), E/D = 0.04, g⊥ = 2.25, and g‖ = 2.38. Trace E is a simulation of trace D with parameters D = 50 cm−1 (i.e., D ≫ gβBS, MS = |±1/2〉), E/D = 0.11, g⊥ = 2.25, and g‖ = 2.36. Trace H is the sum of traces C and E, shown with twofold reduced amplitude