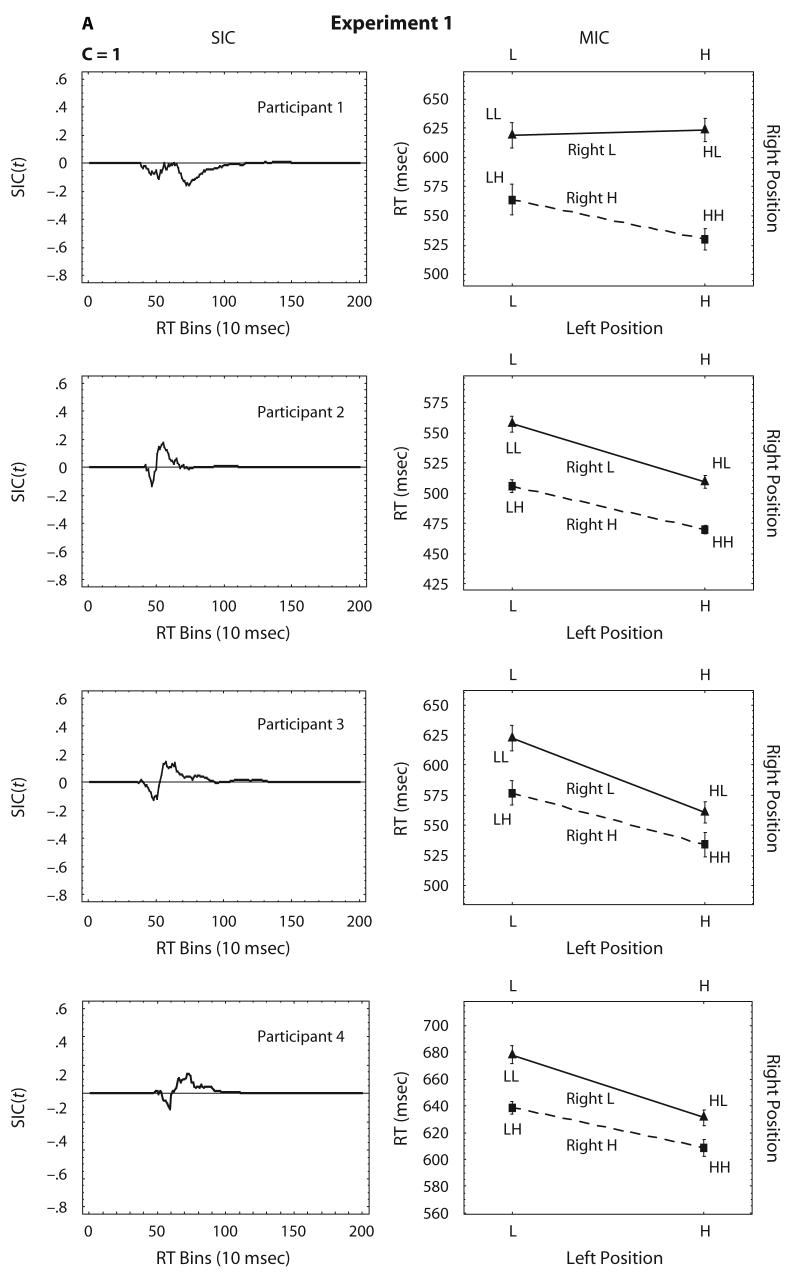
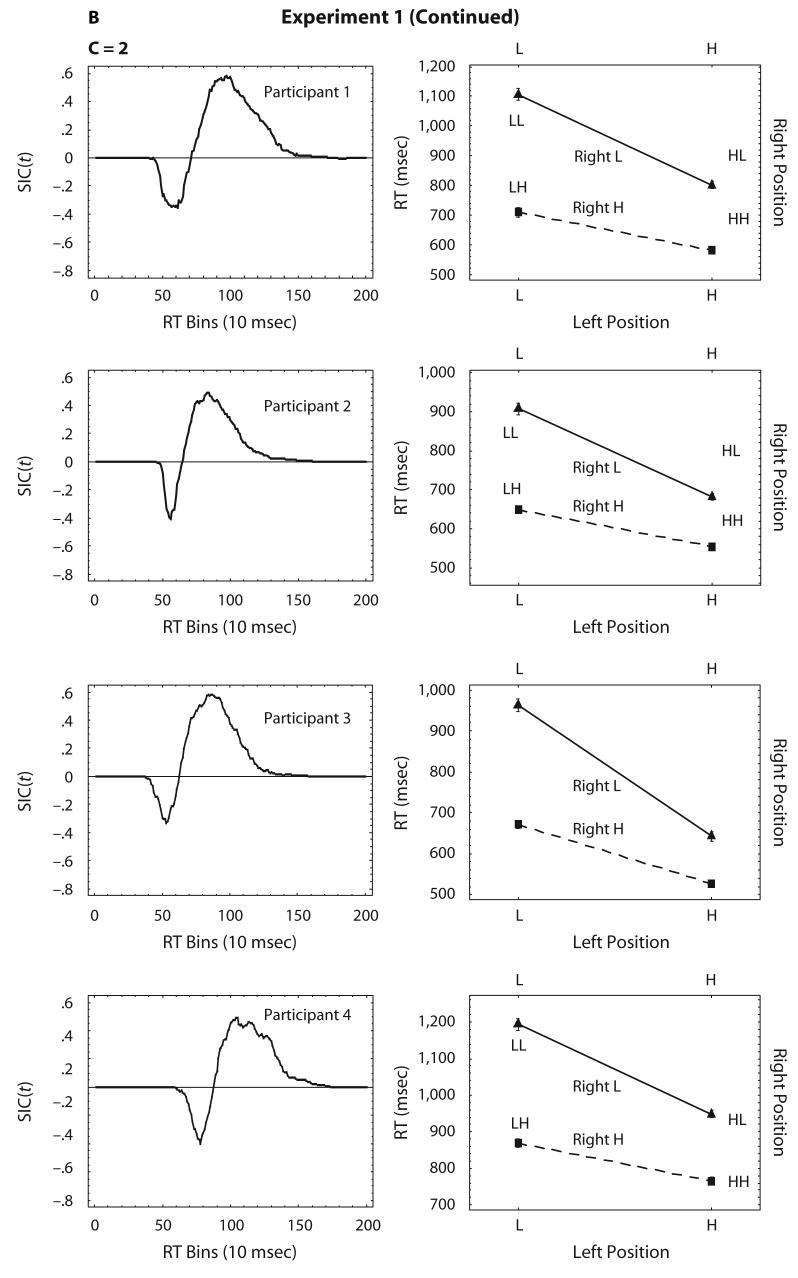
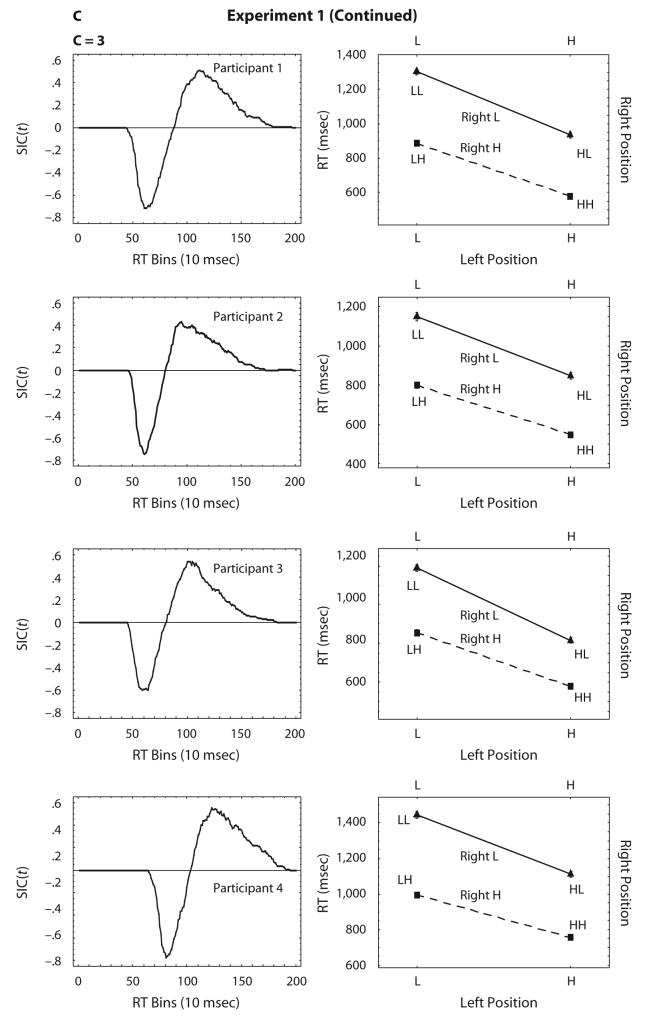
Figure 2.
Systems factorial technology analysis of the data from Experiment 1 (only for the target-absent trials). The survivor interaction contrast (SIC) and the mean interaction contrast (MIC) are presented from left to right. Error bars around each mean represent the standard error statistic. Different participants are presented in different rows, and the figures are sorted by the item complexity level (C = 1, 2, 3).


