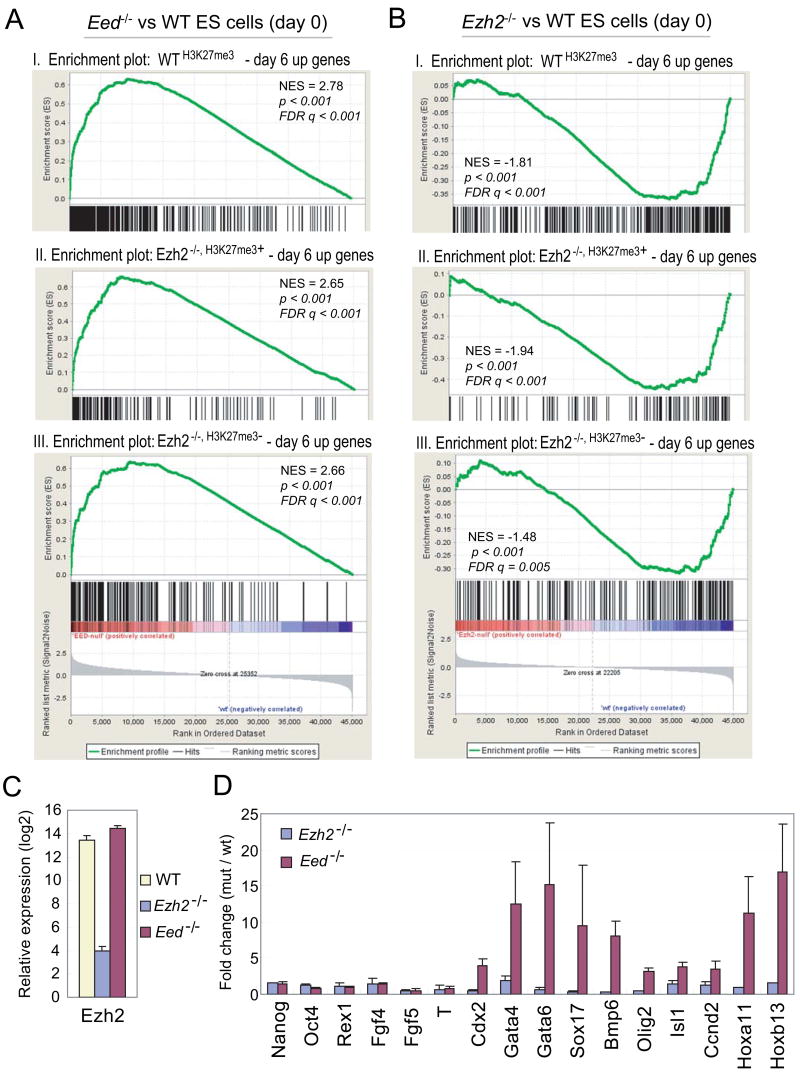
Figure 4. Ezh2 is dispensable for the maintenance of ES cell identity.
(A–B) GSEA profiles of three subsets of H3K27me3 targets by comparing undifferentiated Eed−/−(A) or Ezh2−/− ES cells (B) to wild-type (WT) ES cells. Panel I, WTH3K27me3 – day 6 up genes; Panel II, Ezh2−/−, H3K27me3+ – day 6 up genes; Panel III, Ezh2−/−, H3K27me3− – day 6 up genes. All three subsets show positive normalized enrichment scores (NES) in Eed−/− ES cells but negative NES in Ezh2−/− ES cells, suggesting derepression in Eed−/− ES cells but repression in Ezh2−/− ES cells. (C) Ezh2 transcript is reduced ~ 1000 fold in Ezh2−/− cells compared to that in WT and Eed−/− cells. (D) Fold changes of gene expression in mutants versus wild-type cells.

