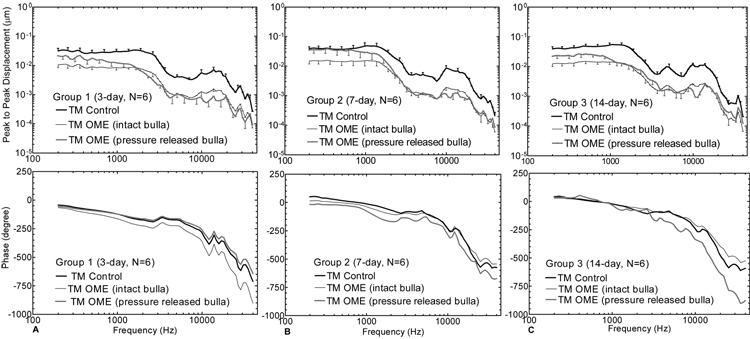
Figure 6.
Mean (+/− SD) TM displacement magnitude (upper panel) and phase (lower panel) in response to 80 dB SPL at the ear canal at frequencies of 200 ~ 40 kHz. The dark solid lines represent the control curves; the thin lines represent the measurements from intact OME ears; and the grey lines represent the curves from pressure-released OME ears. (A) Group 1; (B) Group 2; (C) Group 3.

