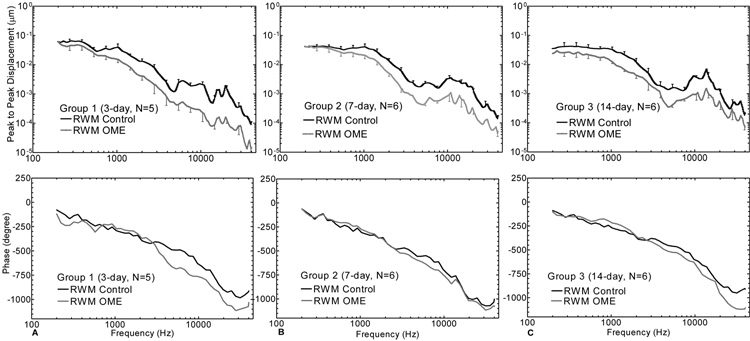
Figure 7.
Mean (+/− SD) RWM displacement magnitude (upper panel) and phase (lower panel) in response to 80 dB sound pressure at the ear canal at frequencies of 200~40k Hz. The dark solid lines represent the control curves and the grey lines represent the OME curves. (A) Group 1; (B) Group 2; (C) Group 3.

