
Figure 1.
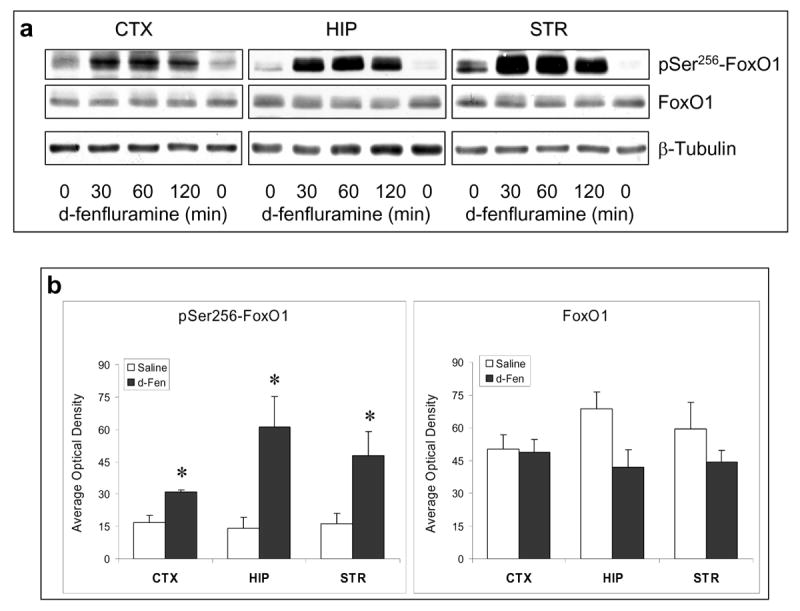
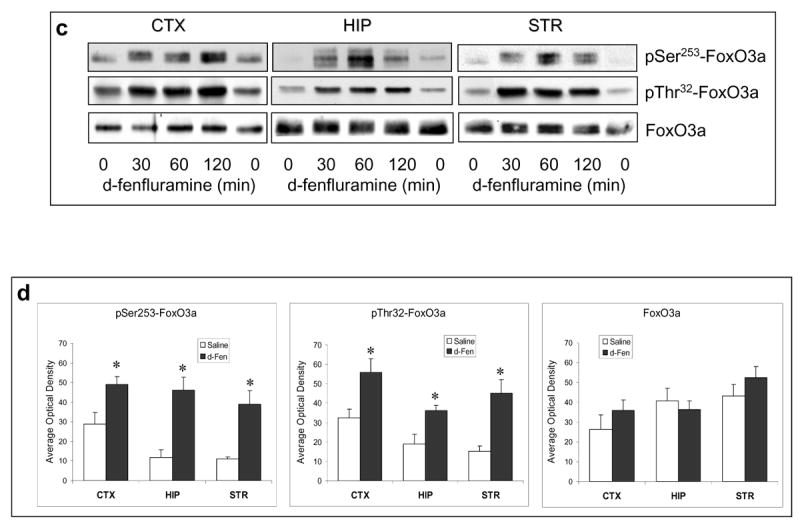
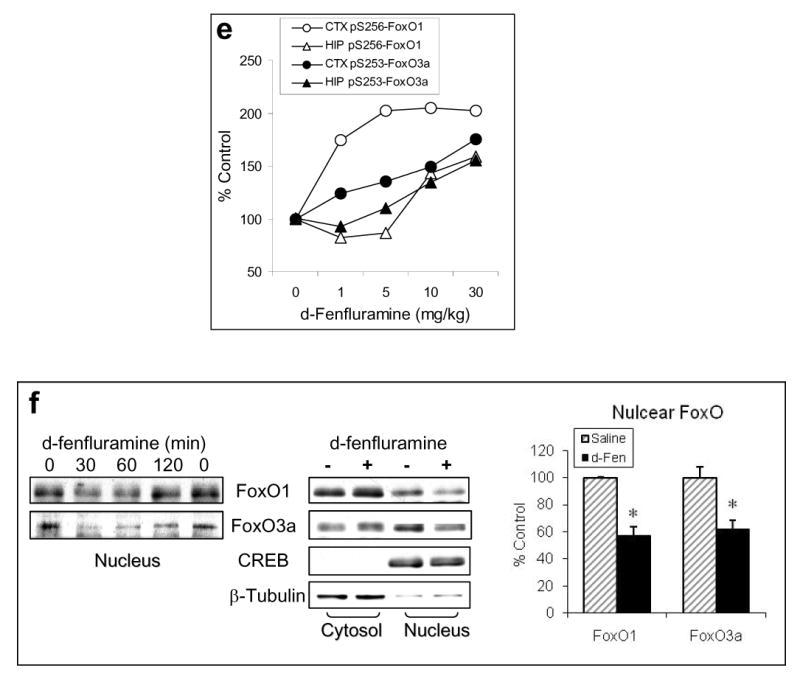
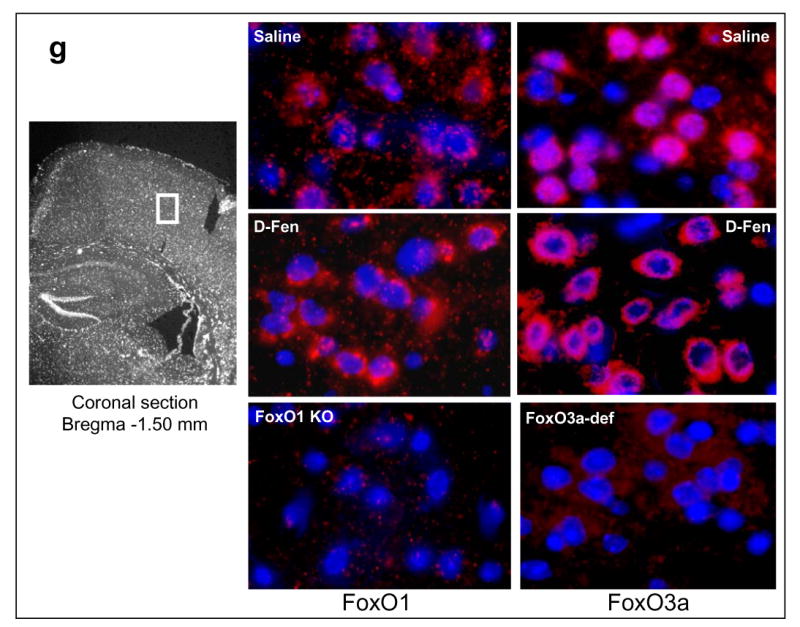
Regulation of FoxOs by d-fenfluramine. C57BL/6 mice were treated with d-fenfluramine before FoxO proteins from homogenates of the cerebral cortex (CTX), hippocampus (HIP), and striatum (STR) were examined by immunoblots. (a) Immunoblots of brain phospho-Ser256-FoxO1 and total FoxO1 after saline (0 min) or d-fenfluramine treatment (50 mg/kg, i.p.). (b) Quantification of phospho-Ser256-FoxO1 (t-test; CTX: t=-4.324, p=0.003; HIP: t=-3.205, p=0.013; STR: t=-2.559, p=0.043; n=4-5 per group) and total FoxO1 after saline or d-fenfluramine (d-Fen) treatment for 2 hr. (c) Immunoblots of brain phospho-Ser253-FoxO3a, phospho-Thr32-FoxO3a, and total FoxO3a after d-fenfluramine treatment. (d) Quantification of phospho-Ser253-FoxO3a (t-test; CTX: t=-2.805, p=0.023; HIP: t=-4.356, p=0.005; STR: t=-4.660, p=0.003; n=4-5 per group), phospho-Thr32-FoxO3a (t-test; CTX: t=-2.842, p=0.030; HIP: t=-2.993, p=0.040; STR: t=-4.110, p=0.015; n=3-4 per group), and total FoxO3a after saline or d-fenfluramine treatment for 2 hr. Data are mean ± SEM. *p<0.05 when values are compared to saline treatment in Student's t-test. (e) Dose-dependent response of FoxO1 and FoxO3a to d-fenfluramine in the cerebral cortex and hippocampus. Values are expressed as % saline treatment (Control). (f) Immunoblots of nuclear and cytosolic FoxO1 and FoxO3a from the cerebral cortex of mice treated with saline (0 min) or d-fenfluramine for indicated times (left panel) or 1 hr (middle panel). Data from nuclear FoxO1 and FoxO3a were quantified and calculated as % saline treatment. *p<0.01 when values are compared to saline treatment (t-test; FoxO1: t=5.765, p=0.001; FoxO3a: t=3.911, p=0.006; n=5 per group). (g) Immunohistochemical detection of brain FoxO1 and FoxO3a. C57BL/6 mice were treated with saline- or d-fenfluramine. Coronal section of mouse brain at Bregma -1.5 mm position was photographed under a 10× objective (left) with the mid cortical region squared for capturing Immuno-fluorescent images of FoxO1 and FoxO3a under a 100× objective. In the colored fluorescent photographs, red color shows FoxO1 and FoxO3a, respectively, and blue color shows nuclear stain. For negative controls, brain sections from the FoxO1 knockout mouse and the FoxO3a-deficient mouse were immuno-stained with anti-FoxO1 and anti-FoxO3a antibodies, respectively.