
Figure 5.

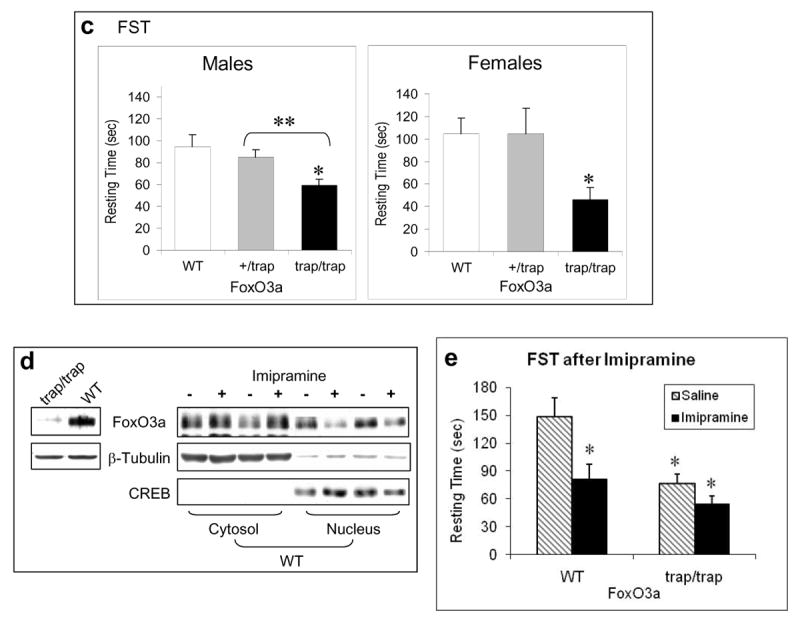
Behavior tests in FoxO3a-deficient mice. Homozygous (trap/trap) and heterozygous (+/trap) FoxO3a-deficient and matching wild-type (WT) mice were subjected to behavioral tests (male: n=10; female: n=9 for each test). (a) The EPMT in male and female mice. (b) Baseline OFT in male mice. (c) The FST in male and female mice. Data are expressed as mean ± SEM. Statistical analysis is conducted using one-way ANOVA (male: Fgenotype(2,30)=4.647, p=0.017; female: Fgenotype(2,15)=5.959, p=0.012) with pair-wise comparisons of sample means via the Tukey HSD test. *p<0.05 when the testing group was compared to the wild-type mice, and **p<0.05 when heterozygous were compared to homozygous FoxO3a-deficient mice. (d) The level of total FoxO3a in the cerebral cortex of FoxO3a-deficient (trap/trap) and wild-type (WT) mice (left panel), and in the cytosolic and nuclear fractions of the cerebral cortex of wild-type mice treated with saline or imipramine for 28 days (right panel). (e) Male FoxO3a-deficient (trap/trap) and littermate wild-type (WT) mice were treated with either saline or imipramine (20 mg/kg/d, i.p.) for 23 days before the FST. Data are mean ± SEM. Statistical analysis is conducted using one-way ANOVA (Fgenotypextreatment (3,25)=8.543, p<0.001) with post hoc multiple group comparisons (n=6-8). Since this analysis involved 6 comparisons, all p-values less than 0.008 were considered significant. *p<0.005 when data from each testing group was compared to the saline-treated wild type group.