Abstract
The change in heat capacity, ΔCp, upon protein unfolding has been usually determined by calorimetry. A non-calorimetric method which employs the Gibbs-Helmholtz relationship to determine ΔCp has seen some use. Generally, the free energy change upon unfolding of the protein is determined at a variety of temperatures and the temperature at which ΔG is zero, Tm, and change in enthalpy at Tm are determined by thermal denaturation and ΔCp is then calculated using the Gibbs-Helmholtz equation. We show here that an abbreviated method with stability determinations at just two temperatures gives values of ΔCp consistent with values from free energy change upon unfolding determination at a much wider range of temperatures. Further, even the free energy change upon unfolding from a single solvent denaturation at the proper temperature, when coupled with the melting temperature, Tm, and the van’t Hoff enthalpy, ΔHvH, from a thermal denaturation, gives a reasonable estimate of ΔCp, albeit with greater uncertainty than solvent denaturations at two temperatures. We also find that non-linear regression of the Gibbs-Helmholtz equation as a function of stability and temperature while simultaneously fitting ΔCp, Tm, and ΔHvH gives values for the last two parameters that are in excellent agreement with experimental values.
Keywords: protein stability, cold denaturation
Introduction
One of the more interesting aspects of the thermodynamics of proteins is the non-zero values of the change in heat capacity (ΔCp) upon unfolding. The change in heat capacity (ΔCp) upon denaturation can be determined directly by calorimetric methods, but this requires large amounts of protein and specialized equipment. Pace and Laurents1 introduced a non-calorimetric method using a combination of solvent and thermal denaturation derived stability data in the Gibbs-Helmholtz equation to calculate the ΔCp for the unfolding of ribonuclease T1 and ribonuclease A. Pace and Makhatadze2 determined the ΔCp for the unfolding of ribonuclease A using differential scanning calorimetry and found that the non-calorimetric method gave very similar results. This non-calorimetric method has since seen successful application to a variety of proteins, but several questions remained.
In large part because of the length of time required to achieve equilibrium at low temperatures, Pace and Laurents examined only a fairly narrow temperature range from 19 to 29 °C. One possible criticism is that data collected over a wider temperature range might give a different result for ΔCp. Automated equipment developed in our laboratory3,4 makes it relatively easy for us to conduct solvent denaturations with long equilibration times. Further, Pace and Laurents calculated ΔCp at different temperatures and averaged them or fitted the curve of stability versus temperature to the Gibbs-Helmholtz equation by manual adjustment of the value of ΔCp, less practical than non-linear regression over a wide temperature range. Non-linear regression also offers the possibility of calculating the melting temperature, Tm, and the van’t Hoff enthalpy, ΔHvH, and comparing these values derived from ΔG as a function of temperature to those obtained experimentally from a thermal denaturation as a validation of the procedure. Lastly, while several wild-type proteins and a few mutants have been examined, a large series of mutant proteins has never been examined. Therefore, we decided to determine the free energy change upon unfolding, which, in interest of conciseness, we will usually refer as stability, over a wide range of temperatures for wild-type staphylococcal nuclease and 22 mutant proteins in order to determine ΔCp.
Materials and Methods
Mutagenesis, Protein Expression, and Protein Purification
The construction, expression and purification of the mutants of staphylococcal nuclease used in this study has been described elsewhere.5–8 Briefly, a set of single, double, triple, quadruple and multiple mutants were previously constructed to include every possible permutation of leucine, isoleucine and valine at two overlapping sets of four positions (23/25/66/72, 66/72/92/99) in the core of staphylococcal nuclease. In most cases new preparations of protein were made and found to give results consistent with earlier work. We selected all 16 possible quadruple mutants at 23/25/66/72. Because this set generally has values of mGuHCl below that of wild-type nuclease, we also selected 6 additional mutants from the 66/72/92/99 set which had values of mGuHCl equal to or greater than wild-type. The melting temperature (Tm) of most mutants were at or above 40 °C, thus providing a relatively wide temperature range at which free energy change upon unfolding could be reliably determined.
Thermal Denaturation and Data Analysis
The thermally-induced unfolding of nuclease was monitored by probing the changes in intrinsic fluorescence of the protein as a function of temperature. The experiments were carried out as previously described.3,4,9 Wild-type staphylococcal nuclease has been thermally denatured 42 times and the values used here are the previously reported averages.9
Guanidine Hydrochloride Denaturation and Data Analysis
The stabilities of the mutants were determined by guanidine hydrochloride denaturation in an AVIV model ATF-101 fluorometer as previously described.3,4 The guanidine hydrochloride solution (6M GuHCl, 100 mM NaCl, 25mM sodium phosphate, pH 7.0) used in these experiments was prepared with extreme caution to maintain the concentration and pH. Note that this is slightly different from earlier work in the Stites laboratory, with the inclusion of sodium chloride in the guanidine hydrochloride solution. Data analysis was carried out assuming a two-state model for reversible protein unfolding. This data analysis yields three parameters: the stability difference in the absence of denaturant between a protein’s native and denatured states (ΔGH2O), the rate of change of free energy with respect to guanidinium hydrochloride (GuHCl) concentration (mGuHCl or d(ΔG)/d[GuHCl]), and the concentration of GuHCl at which the protein is half denatured (Cm).
Isothermal guanidine hydrochloride-induced unfolding experiments were carried out, at 4, 10, 15, 20, 30, and 40 °C for mutants and 3, 10, 15, 20, 25, 30, 40, and 50 °C for wild-type. In solvent titration experiments at or above 15 °C, a 5–8 minute equilibration time period was required between two additions. This time period allowed for proper equilibration of the native and denatured states. Occasional longer intervals in each denaturation were used to confirm that sufficient time was allowed for equilibration. However at 10°C or lower, the equilibration time interval had to be increased to 20 minutes. During denaturation experiments at lower temperatures, the equilibration time interval at a data point near Cm was increased to 35 minutes. This allowed us to confirm that 20 minutes was sufficient to reach equilibrium. In order to prevent condensation on the walls of the cuvette at lower temperatures (4 °C and 10 °C), a slow stream of liquid nitrogen boil off at low pressure was used. At higher temperatures (30 °C and 40 °C) noise problems were encountered due to the formation of bubbles on the cuvette wall. To avoid bubbles, the buffer was degassed by raising the temperature to about 5 °C above the experimental temperature for 10 minutes. The cuvette was then removed from the holder and gently tapped to dislodge the bubbles. The temperature was lowered to the desired experimental value and the protein stock solution was added. The sample was covered with a small plastic lid to prevent evaporation. All the quadruple mutants were previously characterized by guanidine hydrochloride denaturations7 at 20 °C, but were redetermined as part of this study so that all thermal and guanidine hydrochloride denaturations were measured using protein from a single preparation.
Non-linear regression analysis
The free energy difference between native and denatured states obtained from guanidine hydrochloride denaturation experiments at various temperatures and mid-point temperature and van’t Hoff enthalpy obtained from thermal denaturation experiments were fit to the Gibbs-Helmholtz equation (Eq. 1) using non-linear regression. SigmaPlot (versions 9.01 or 10) was used for the non-linear regression analysis and various starting values were tested to ensure that the algorithm converged to a common value.
| (Eq. 1) |
In the Gibbs-Helmholtz equation Tm (midpoint temperature or melting temperature) is the temperature at which half the protein molecules are unfolded. ΔHvH is the van’t Hoff enthalpy at the melting temperature and ΔCp is the change in heat capacity upon protein unfolding. The assumption is made that ΔCp is not a function of temperature.
By rearranging the Gibbs-Helmholtz equation (Eq. 1) we obtain Eq. 2 from which ΔCp can be calculated by substituting the values of ΔHvH and Tm from thermal data and ΔG is ΔGH2O from solvent denaturation data.
| (Eq. 2) |
The non-linear regression analysis on each mutant was done in four different ways:
The mid-point temperature Tm and van’t Hoff enthalpy ΔH obtained from thermal denaturation experiments were defined. A non-linear regression of ΔGcalc (predicted values) against ΔGH2O (experimental values) was performed while fitting only ΔCp.
ΔH was defined experimentally and regression of ΔGcalc against ΔGH2O was done while fitting the values of Tm and ΔCp.
Tm was defined experimentally and regression of ΔGcalc against ΔGH2O was done while fitting the values of ΔH and ΔCp.
None of the thermodynamic parameters were defined and a non-linear regression of ΔGcalc against ΔGH2O was carried out while the values of ΔH, Tm and ΔCp were all allowed to fit.
Further, non-linear regression was first done against all the stabilities obtained over the entire temperature range, and then just with stabilities determined at 15 and 20°C, and just with stabilities determined at 20 and 30°C.
Regression was done for the mutant proteins using only a single stability value at each temperature, that being the most recently obtained, if more than one was available. However for wild-type, to which all mutants are referred, we used all available data, including 106 independent determinations of free energy change upon unfolding at 20°C.
Results
Previously our laboratory constructed a large set of conservative packing mutants to include every possible permutation of leucine, isoleucine, and valine at two overlapping sets of four positions (23/25/66/72, 66/72/92/99) in the core of staphylococcal nuclease.5–8 A subset of 22 quadruple mutants7 was chosen for this present study. The selected mutants had melting temperatures (Tm) at or above 40°C, thus providing a relatively wide temperature range over which free energy change upon unfolding could be determined.
Each of the 22 mutants, along with wild type nuclease, was characterized by thermal denaturation experiments using the fluorescence of Trp140 as a probe of structure, as described elsewhere.3 During the original work on these mutants, thermal denaturations had previously been obtained (J. Chen and W. E. Stites, unpublished observations). Thermal and guanidine hydrochloride denaturations were performed again so that all thermal and guanidine hydrochloride denaturations were measured using protein from a single preparation. Stabilities reported here are the same as those previously reported within the range of expected experimental error. Table I includes the midpoint temperatures, Tm, and van’t Hoff enthalpies, ΔHvH, newly obtained.
The free energy difference (ΔGH2O) between the native state and denatured state is the measure of protein stability determined from guanidine hydrochloride denaturation experiments. Each of the 22 mutants was previously characterized by guanidine hydrochloride at 20°C7 but stability at this temperature was determined again, as well as at 4, 10, 15, 20, 30, and 40°C. Stabilities reported here are the same as those previously reported within range of expected experimental error. The values of ΔGH2O, the midpoint concentration, Cm, and the rate of change of ΔG with respect to guanidine hydrochloride concentration, or slope value, mGuHCl at all the temperatures examined are available in supplementary material online.
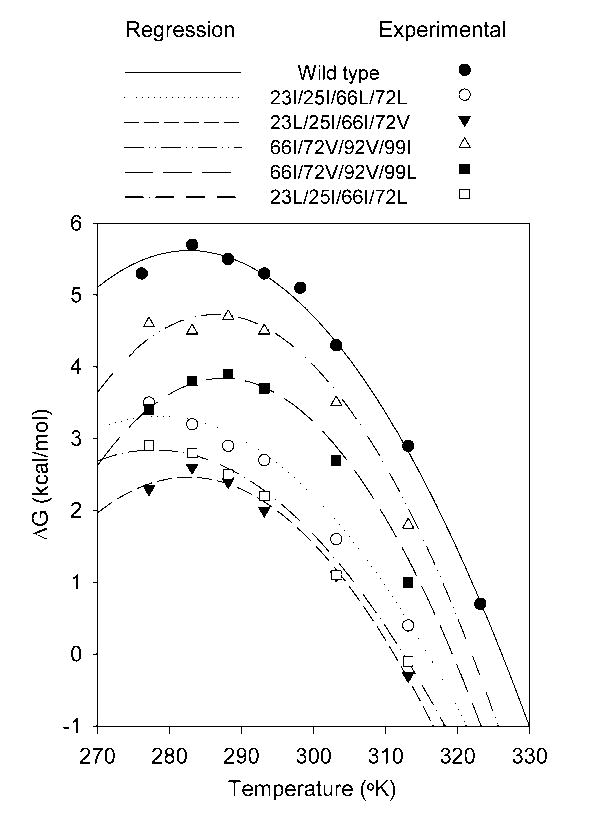
Non-linear regression analysis was used to fit ΔG values predicted by the Gibbs-Helmholtz equation to various experimentally determined ΔGH2O values obtained at different temperatures. The stabilities of wild-type and five representative mutants are depicted as a function of temperature in Figure 1. As shown in Table I, by defining or fitting different combinations of thermodynamic parameters, four different values of ΔCp were obtained by non-linear regression analysis as described in Materials and Methods. The value of ΔCp obtained by defining Tm and ΔHvH as values obtained experimentally in thermal denaturation while using all the stabilities at all temperatures is referred to as the global value and is shown in the first column. In the second and third columns, respectively, are the experimentally determined values of Tm and ΔHvH. In the fourth and fifth columns are the fitted values of ΔCp and ΔHvH when Tm is defined as the value experimentally determined. Similarly, in the sixth and seventh columns are the fitted values of ΔCp and Tm when ΔHvH is defined as the value experimentally determined. Finally, the last three columns are those values obtained by allowing ΔCp, ΔHvH, and Tm all to simultaneously vary when fitting the ΔG values predicted by the Gibbs-Helmholtz equation to experimentally determined ΔGH2O values.
Figure 1.
Plot of ΔGH2O against temperature for wild-type staphylococcal nuclease and five representative quadruple mutants. The mutant 23I/25I/66L/72L was chosen as it has a low ΔCp and subjectively amongst the worst fits. The mutant 23L/25I/66I/72V has a markedly lower stability than wild-type, yet has a ΔCp that is nearly the same and a subjectively good fit. The mutants 66I/72V/92V/99I and 66I/72V/92V/99L are poor and good fits respectively but both with high ΔCp. The mutant 23L/25I/66I/72L has a low ΔCp and a good fit. The lines are the best fit against the Gibbs-Helmholtz equation obtained by non-linear regression of predicted ΔG against ΔGH2O for all measured temperatures while defining Tm and ΔH as the values obtained from thermal denaturation experiments. The points indicate experimental data obtained at various temperatures. The standard deviation in ΔGH2O found in repeated determinations of wild-type stability at 20°C is ± 0.1 kcal/mol.
Discussion
Comparison of ΔCp values with and without fixed, experimental ΔH and Tm values
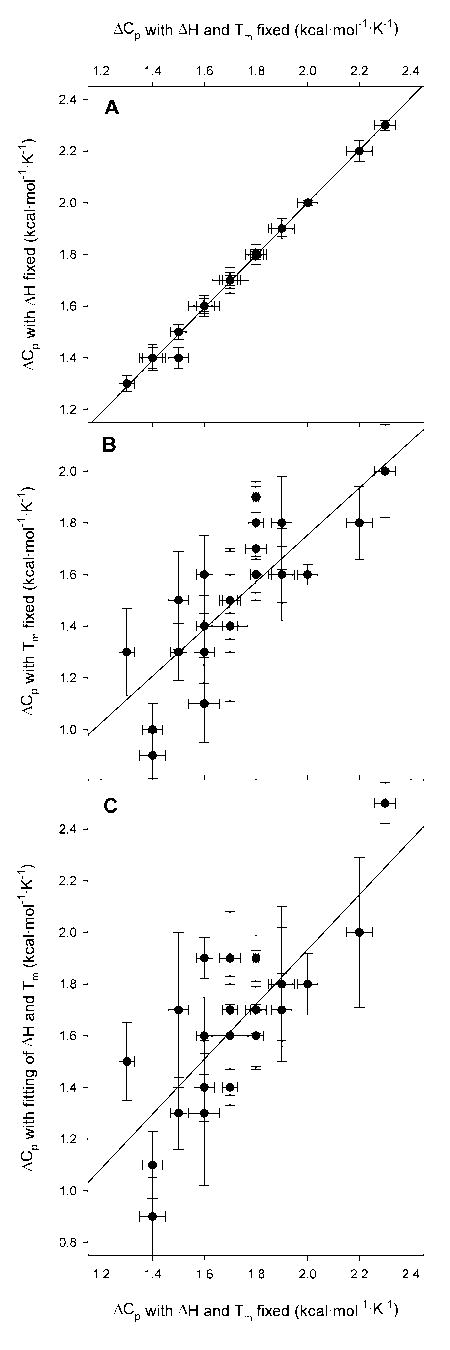
One of the strengths of using non-linear regression to fit the Gibbs-Helmholtz equation to stabilities determined at different temperatures is that it is possible to supply fixed, experimental values for ΔH and Tm, or to fit ΔH, Tm, or both along with ΔCp. This gives an excellent idea of the robustness of the fitting procedure and the possible degree of error. In Figure 2A it is obvious that allowing Tm to float has little impact on the value of ΔCp.
Figure 2.
Comparison of ΔCp values with and without fixed, experimental ΔH and Tm values. In all panels the x axis is the global ΔCp. This is the value of ΔCp obtained by fitting predicted ΔG against ΔGH2O for all measured temperatures while defining Tm and ΔH as the values obtained from thermal denaturation experiments. In panel A, the global ΔCp is plotted against the value of ΔCp returned by the regression when ΔH is fixed as the experimental value obtained from thermal denaturation and Tm is fit as well. In panel B, the global ΔCp is plotted against the value of ΔCp found by the regression when Tm is fixed as the value obtained from thermal denaturation and ΔH is now fit. In panel C, the global ΔCp is plotted against the value of ΔCp returned when ΔCp, ΔH, and Tm are all fit by non-linear regression at once. In all cases, the error bars are those given by the regression and the lines are the least square regression of ΔCp versus ΔCp.
The value of ΔCp is much more dependent upon the value of ΔH, as illustrated in panels 2B and 2C. The value of ΔH is a much more informative constraint on fitting than is Tm. There is much less agreement between the value of ΔCp with ΔH defined as the experimental value and the value when ΔH is allowed to float. Although the overall fit is better when both ΔCp and ΔH are allowed to vary, the error estimate returned by the regression program for ΔCp dramatically increases. This is again due to the fact that the values of ΔCp and ΔH are tightly coupled. While larger than the error when ΔH is defined, these errors, on the order of ± 0.2 kcal/(mol·K), compare favorably with the ± 0.5 kcal/(mol·K) estimated for calorimetrically determined ΔCp.
Comparison of fitted ΔH and Tm values with experimental values
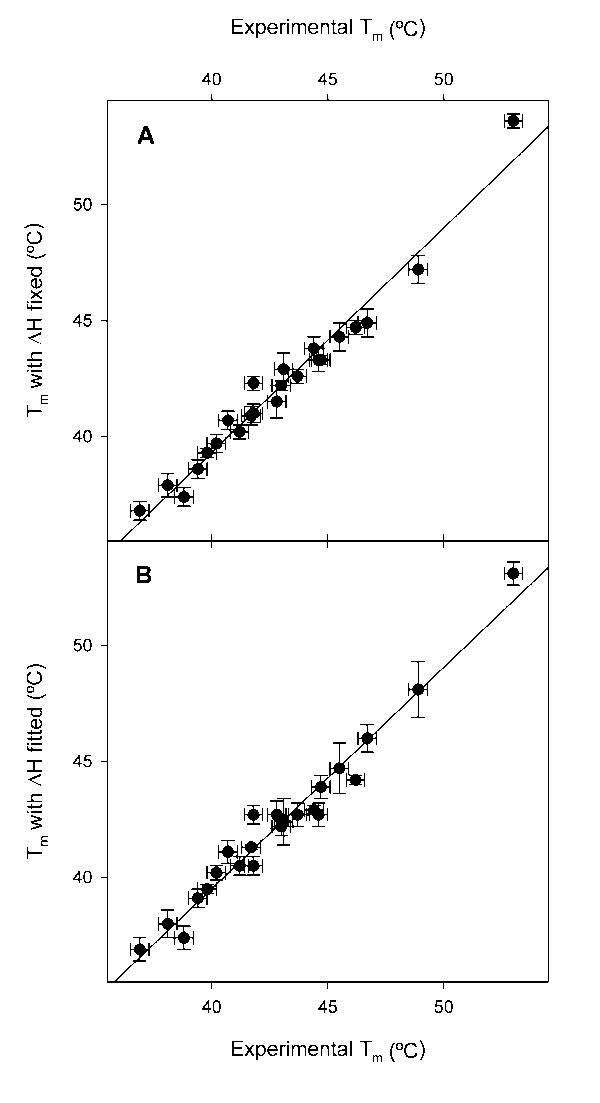
When both ΔCp and Tm are fitted by non-linear regression the regression values are very similar to the experimental values, as shown in Figure 3A. Even when all three variables in the Gibbs-Helmholtz equation, ΔCp, ΔH and Tm, are fit simultaneously the values of Tm hardly diverge from the experimental values (Figure 3B). The melting temperature, Tm, for nuclease is experimentally quite well defined in the thermal denaturation experiment, with an error of only ± 0.4°, so there is little to be gained from obtaining it via regression. Further, it is quite reassuring to see that the regression returns, within experimental error, the same value, meaning that the curve of ΔGH2O versus temperature defines Tm quite well.
Figure 3.
Comparison of experimental Tm values to those derived from non-linear regression. In both panels the x axis is the experimental Tm. In panel A, the experimental Tm is plotted against the value of Tm returned by the regression when ΔH is fixed as the value obtained from thermal denaturation while ΔCp is fit as well. In panel B, the experimental Tm is plotted against the value of Tm returned when ΔCp, ΔH, and Tm are all fit by non-linear regression at once. The error bars in the y axis are those given by the regressions, the error in the x axis is the ± 0.4° standard deviation found in repeated thermal denaturations of wild-type staphylococcal nuclease.9 The lines are the least square regression of Tm versus Tm.
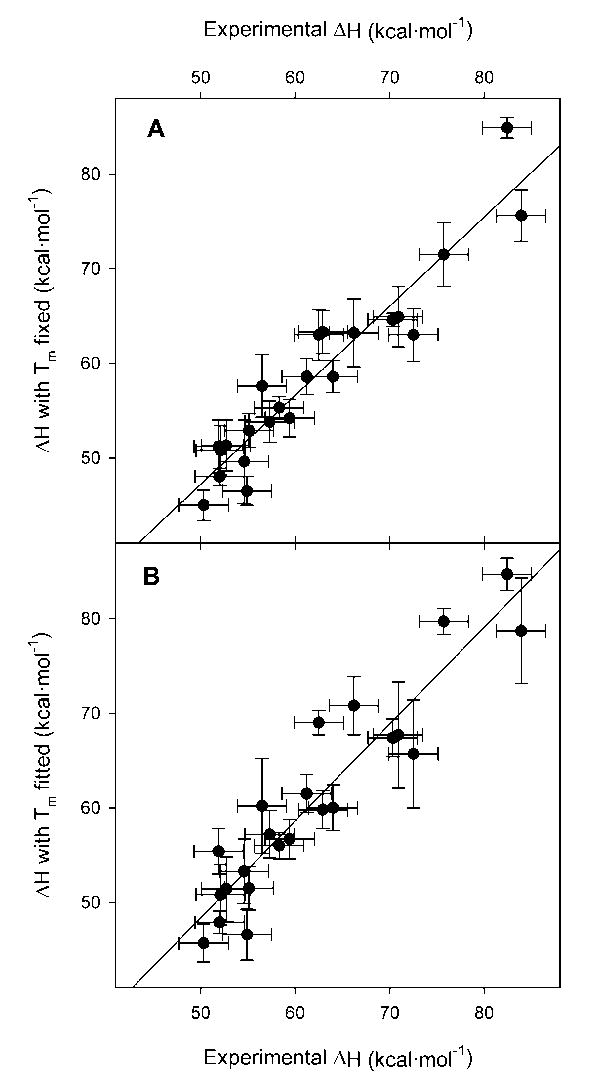
When both ΔCp and ΔH are fitted while Tm is fixed at the experimental value, ΔH does not usually vary more than the amount of the experimental error. However, close inspection of Figure 4A reveals that the experimental values at the low end of the range tend to be greater than those returned by regression as evidenced by the greater slope of the least squares regression of experimental ΔH versus regression ΔH.
Figure 4.
Comparison of experimental ΔH values to those derived from non-linear regression. In both panels the x axis is the experimental ΔH. In panel A, the experimental ΔH is plotted against the value of ΔH returned by the regression when Tm is fixed as the value obtained from thermal denaturation while ΔCp is fit as well. In panel B, the experimental ΔH is plotted against the value of ΔH returned when ΔCp, ΔH, and Tm are all fit simultaneously by non-linear regression. The error bars in the y axis are those given by the regressions, the error in the x axis is the ± 2.6 kcal/mol standard deviation found in repeated thermal denaturations of wild-type staphylococcal nuclease.9 The lines are the least square regression of ΔH versus ΔH.
Comparison of ΔCp values using stability determined at different temperatures
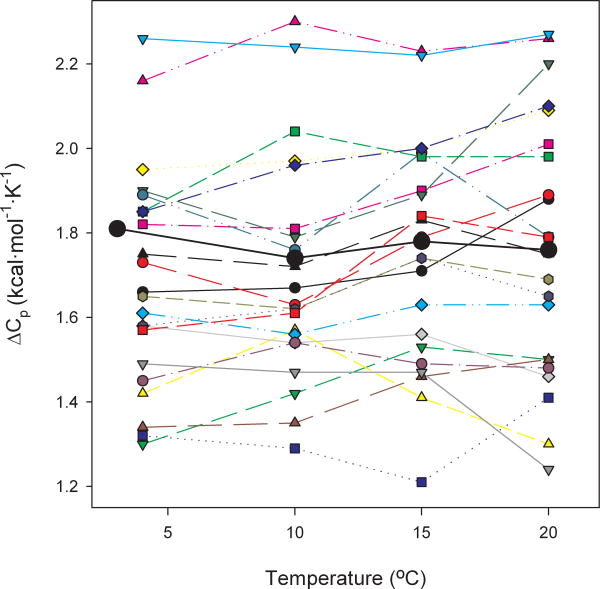
As the curves of stability versus temperature in Figure 1 show, there is good agreement of the predicted ΔG with the observed ΔGH2O over the entire temperature range accessible to us. In other words, the assumption that ΔCp is independent of temperature seems valid. Of course ΔCp may be calculated at a given temperature using the particular free energy difference between the folded and unfolded states determined at that temperature and the experimental values of ΔH and Tm. Generally, up to 20° there is little variation with temperature, as is demonstrated in Figure 5 where such temperature-particular ΔCp values are graphed as a function of temperature. As Pace and Laurents1 pointed out, any error in ΔG translates into a larger error in ΔCp as the Tm is neared. At 40°C, near the melting point of many of the mutants, a change in ΔG of 0.1 kcal/mol translates into a change in calculated ΔCp of as much as 10 or 20 kcal/(mol·K), therefore we do not show single temperature ΔCp values at these higher temperatures. The ΔCp values calculated at 20°C are shown in Table II while all the values calculated at each temperature, including higher temperatures not shown in Figure 5, are available in the online supplementary material.
Figure 5.
Plot of ΔCp versus temperature for all 22 mutants and wild-type. Each ΔCp value is calculated from the experimental ΔH and Tm and the ΔGH2O for that protein at each temperature.
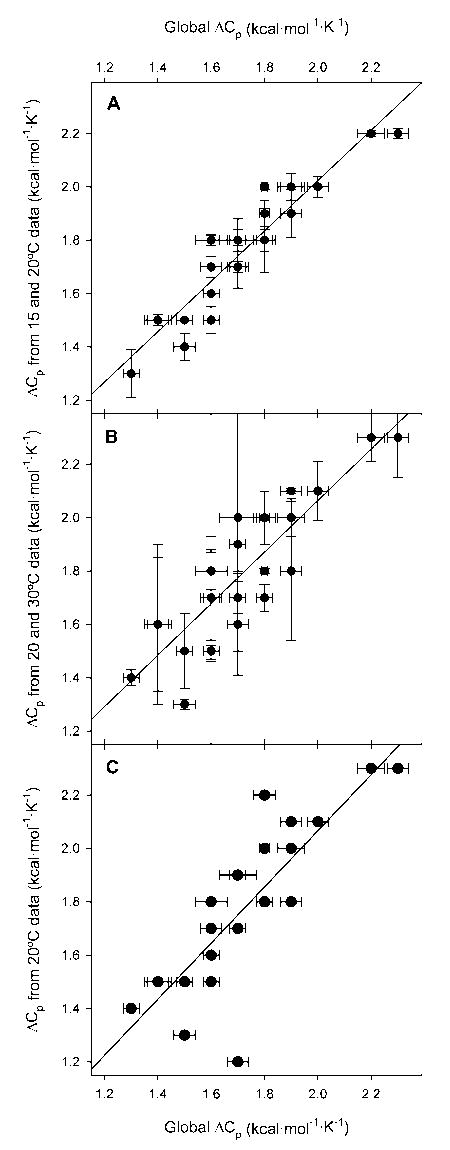
In addition to calculating ΔCp based on a single solvent denaturation and a single thermal denaturation, it is possible to use fewer stabilities in the non-linear regression. The point that error in ΔG translates into a larger error in ΔCp as the Tm is neared means that the values of ΔG near Tm have less informational content and, indeed, their inclusion may be counterproductive. The curvature of ΔG with temperature is greatest near the temperature of maximal stability and this curvature is dictated by ΔCp. Accordingly, we repeated the non-linear regression using the experimentally defined Tm and ΔH, but used only the ΔGH2O data determined at 15 and 20°C, and then again using only the stabilities at 20 and 30°C. These values are given in Table II to the level of precision estimated by the regression program.
In Figure 6 we plot, after rounding to a more realistic single decimal place, the ΔCp values calculated from these more limited data sets to that calculated from the global dataset. The agreement is quite good in general. A linear regression of dependent variable ΔCp from the fit to the 15 and 20°C data against the independent variable, ΔCp from the global fit, gives a standard error for the 15 and 20°C ΔCp of ± 0.1 kcal/(mol·K). Similarly, the standard error in the ΔCp from the 20 and 30°C data was ± 0.1 kcal/(mol·K). Interestingly, linear regression of ΔCp values calculated solely from the 20°C data against the global ΔCp values gives a standard error that is higher, but still a quite respectable ± 0.2 kcal/(mol·K). Of course, the independent variable has error in it, estimated at ± 0.2 kcal/(mol·K). The error in either the ΔCp from the fit to the 15 and 20°C data or the ΔCp from the 20 and 30°C data is the same, (0.22 + 0.12)1/2 = 0.22, which rounds to ± 0.2 kcal/(mol·K). The error in ΔCp calculated from the 20°C data is slightly greater, (0.22 + 0.22)1/2 = 0.28, which rounds to ± 0.3 kcal/(mol·K).
Figure 6.
Comparison of ΔCp values calculated with ΔGH2O values determined at different temperatures and the values of ΔH and Tm from a thermal denaturation. In all panels the x axis is the global ΔCp. This is the value of ΔCp obtained by fitting predicted ΔG against ΔGH2O for all measured temperatures while defining Tm and ΔH as the values obtained from thermal denaturation experiments. In panel A, the global ΔCp is plotted against the value of ΔCp returned by the regression against just the stabilities determined at 15 and 20°C. In panel B, the global ΔCp is plotted against the value of ΔCp returned by the regression against just the stabilities determined at 20 and 30°C. In panel C, the global ΔCp is plotted against the value of ΔCp calculated from just the stability determined at 20°C. In all cases, the error bars are those given by the regression and the lines are the least square regression of ΔCp versus ΔCp.
What is the error in the value of ΔCp? In various tables and graphs we give the standard error estimates returned from the non-linear regression. This estimate is best understood as the range of values that give a similar degree of fit of the predicted ΔG from the Gibbs-Helmholtz equation to the experimental ΔGH2O values. In particular for the global fit, this error (an average ± 0.04 kcal/(mol·K)) is artificially low since it does not take into account the possible error in ΔH and Tm. When all thermodynamic parameters, ΔCp, ΔH, and Tm, are simultaneously fit the error estimates returned for Tm (an average ± 0.5°) and ΔH (an average ± 2.8 kcal/mol) are very similar to the experimental errors for wild-type (Tm ± 0.4°, ΔH ± 2.6 kcal/mol) that we have verified by long experience.9 This implies that the error estimates for ΔCp in this case are reasonable, although even at an average ± 0.2 kcal/(mol·K) this is still excellent for this notoriously difficult to measure parameter.
This should not be interpreted as implying that the values returned when ΔCp, ΔH, and Tm are all simultaneously fit are more accurate. ΔGiven the high degree of autocorrelation of ΔCp and ΔH it is clear that providing a good value for ΔH will greatly increase the accuracy of ΔCp. Rather, the precision of the regression when providing experimental values for ΔH and Tm is clearly incorrect and the true precision (error) is better reflected in the simultaneous fit. To acknowledge this fact, in Table I we limit the number of significant digits.
Finally our data clearly show that there is no need to routinely make measurements over a wide temperature range. This is because the stabilities taken at lower temperatures have a much greater impact on the value of ΔCp than the high temperature data. Therefore measuring ΔGH2O within 10 or even 15° of Tm does little to improve the accuracy of ΔCp, although it does improve values of Tm if one wishes to determine that by non-linear regression. On the other hand, accurate determination of ΔCp does not require extreme low temperature data. Indeed, the global fit is likely to be less accurate than a fit using a more limited temperature range. It was extremely difficult to collect good data at 10° and below. Problems with condensation, ensuring adequate equilibration times, and the increased chances of misadventure in a data collection that takes nearly a complete day not only required many data sets to be recollected but also lead to us to believe that there is a much greater chance that stabilities determined at low temperature have greater potential for error and, of course, error here translates into large errors in ΔCp.
Comparison with wild-type ΔCp literature values
Our value of ΔCp for wild-type staphylococcal nuclease of 1.8 kcal/(mol·K) agrees well with literature values. The ΔCp of wild type nuclease was first determined using differential scanning calorimetry (DSC) by Griko et al.,10 although they used a variant with seven additional disordered amino acids at the N-terminus. They found that in 10 mM sodium acetate, 100 mM NaCl the value of ΔCp was 1.8 kcal/(mol·K), with no error estimated. DSC done by Tanaka et al. found a value of 2.2 kcal/(mol·K), again with no error estimate given, in various buffers at 50 mM and 100 mM NaCl.11 Also using DSC, Carra and Privalov measured ΔCp as 2.1 ± 0.5 kcal/(mol·K) in 20 mM sodium phosphate, 100 mM NaCl, 1mM EDTA at pH 7.0.12
Eftink and Ramsay13 estimated a ΔCp value of 2.27 ± 0.15 kcal/(mol·K) for the unfolding of wild-type nuclease in 10 mM TrisHCl, 100 mM NaCl, pH 7.0. They used a different non-calorimetric approach, carrying out a non-linear fit of the Gibbs-Helmholtz equation to two state stability calculated from thermal unfolding followed by fluorescence and CD at 222 and 235 nm as probes of structure. In essence, this approach determines ΔCp as the second derivative of ΔG versus temperature. They fit all three datasets globally, which gave the value listed above, as well as separately to obtain very similar results.
Lasalle et al.14 used a non-calorimetric method somewhat comparable to that used here to calculate a value for nuclease’s ΔCp of 3.1 ± 0.5 kcal/(mol·K). In this work the protein was unfolded using pressure at various temperatures over the range of 1.5 to 35°C using NMR as a probe of structure in D2O, 20 mM Mes at pH 5.3. While ΔCp can vary with pH, little change for the ΔCp of nuclease occurs in the pH range of 5–712 so the offered explanation14 for this high value and an elevated protein stability is the fact that the stabilities were determined in D2O.
As of yet, there is no calorimetric ΔCp available for the mutants of staphylococcal nuclease examined here. One of the interesting questions about the denaturation of nuclease is whether it proceeds by a two state model (used here in the data analysis) or via some intermediate. The first evidence that a two state model might be insufficient was the V66W mutant.15 Bolen’s group has argued convincingly16,17 that neither a simple two or three state model fully explains the data for wild-type nuclease and the majority of mutants that have been studied. They generally favor the variable two state model proposed by Shortle,18,19 wherein the character of the denatured state changes with mutation, denaturant concentration, or temperature. Carra and Privalov, proponents of the three state model for solvent denaturation,20 have concluded that thermal denaturation of wild-type nuclease is two state.12,20 On the other hand, Eftink’s group has shown that V66W mutant with tryptophan or tryptophan analogues, appears to be better fit by a three state thermal unfolding model.21 Maki et al.22,23 showed that a proline-minus variant of nuclease could have no more than 5% of an equilibrium intermediate at any urea concentration, while a F76W mutant of this proline-minus variant has nearly 50% of the protein populating an equilibrium intermediate at moderate urea concentrations. We have recently published data showing that the thermal denaturations of wild-type nuclease and ninety-seven single mutants are identical within experimental error, whether followed by Trp 140 fluorescence or circular dichroism helical signal at 222 nm, putting rather strict limits on the amount of helix that might be present in any putative intermediate.9 The NMR used to measure structure in the ΔCp determination just noted above clearly shows that the C-terminal helix breaks down ahead of the core of the protein, but this is regarded by these workers as a structural fluctuation of the native state.14 Therefore, another reason for elevated ΔCp in this work may be that the two states for which the change in heat capacity is measured may be different from those measured by Trp 140 fluorescence.
While the calorimetric and non-calorimetric values for wild-type agree well, in the longer term, we hope to measure ΔCp for these mutants calorimetrically. The agreement, or lack thereof, between the calorimetric values and the non-calorimetric values presented here will provide useful evidence for determination of the appropriate model for nuclease denaturation.
Conclusion
It is clear for staphylococcal nuclease that ΔGH2O values determined at two or even a single temperature, when coupled with ΔHvH and Tm from a thermal denaturation, give values for ΔCp consistent with ΔGH2O values measured over a much wider temperature range. This validates the use of fewer temperatures, making this approach more experimentally practical. Indeed, not only is the use of fewer temperature more practical, it is superior. The best non-calorimetric values for ΔCp are those fitted by regression against stabilities determined at 15 and 20°C, with a likely error of ± 0.2 kcal/(mol·K). Even ΔCp calculated from the Tm and ΔHvH derived from thermal denaturation and a single ΔGH2O value determined at a temperature near the point of maximal stability is reasonably accurate, with an error of ± 0.3 kcal/(mol·K). Although the exact temperature ranges over which the procedure should be done will vary from protein to protein, a similar approach should work with most proteins that undergo reversible thermal and solvent denaturation. In future communications we will further explore the implications of the ΔCp values we have found in staphylococcal nuclease and the correlation it shows with mGuHCl.
Supplementary Material
Acknowledgments
We are indebted to Junmei Chen, whose careful characterization of the proteins made this study much easier. We also thank other group members, especially Michael Byrne and Lee Manuel, for the wild-type denaturation data used here. The suggestions of the reviewers contributed to the discussion. This work was supported by NIH grant NCRR COBRE P20 RR15569.
References
- 1.Pace CN, Laurents DV. A new method for determining the heat capacity change for protein folding. Biochemistry. 1989;28:2520–2525. doi: 10.1021/bi00432a026. [DOI] [PubMed] [Google Scholar]
- 2.Pace CN, Grimsley RG, Thomas TS, Makhatadze IG. Heat capacity change for ribonuclease A folding. Protein Sci. 1999;8:1500–1504. doi: 10.1110/ps.8.7.1500. [DOI] [PMC free article] [PubMed] [Google Scholar]
- 3.Schwehm JM, Stites WE. Application of automated methods for determination of protein conformational stability. Methods Enzymol. 1998;295:150–170. doi: 10.1016/s0076-6879(98)95039-x. [DOI] [PubMed] [Google Scholar]
- 4.Stites WE, Byrne MP, Aviv J, Kaplan M, Curtis PM. Instrumentation for automated determination of protein stability. Anal Biochem. 1995;227:112–122. doi: 10.1006/abio.1995.1259. [DOI] [PubMed] [Google Scholar]
- 5.Holder JB, Bennett AF, Chen J, Spencer DS, Byrne MP, Stites WE. Energetics of side chain packing in staphylococcal nuclease assessed by exchange of valines, isoleucines, and leucines. Biochemistry. 2001;40:13998–14003. doi: 10.1021/bi011267t. [DOI] [PubMed] [Google Scholar]
- 6.Chen J, Stites WE. Packing is a key selection factor in the evolution of protein hydrophobic cores. Biochemistry. 2001;40:15280–15289. doi: 10.1021/bi011776v. [DOI] [PubMed] [Google Scholar]
- 7.Chen J, Stites WE. Higher-order packing interactions in triple and quadruple mutants of staphylococcal nuclease. Biochemistry. 2001;40:14012–14019. doi: 10.1021/bi011269d. [DOI] [PubMed] [Google Scholar]
- 8.Chen J, Stites WE. Energetics of side chain packing in staphylococcal nuclease assessed by systematic double mutant cycles. Biochemistry. 2001;40:14004–14011. doi: 10.1021/bi011268l. [DOI] [PubMed] [Google Scholar]
- 9.Byrne MP, Stites WE. Thermal denaturations of staphylococcal nuclease wild-type and mutants monitored by fluorescence and circular dichroism are similar: Lack of evidence for other than a two state thermal denaturation. Biophys Chem. 2007;125:490–496. doi: 10.1016/j.bpc.2006.10.014. [DOI] [PMC free article] [PubMed] [Google Scholar]
- 10.Griko YV, Privalov PL, Sturtevant JM, Venyaminov S. Cold denaturation of staphylococcal nuclease. Proc Natl Acad Sci U S A. 1988;85:3343–3347. doi: 10.1073/pnas.85.10.3343. [DOI] [PMC free article] [PubMed] [Google Scholar]
- 11.Tanaka A, Flanagan J, Sturtevant JM. Thermal unfolding of staphylococcal nuclease and several mutant forms thereof studied by differential scanning calorimetry. Protein Sci. 1993;2:567–576. doi: 10.1002/pro.5560020408. [DOI] [PMC free article] [PubMed] [Google Scholar]
- 12.Carra JH, Anderson EA, Privalov PL. Thermodynamics of staphylococcal nuclease denaturation. I The acid- denatured state. Protein Sci. 1994;3:944–951. doi: 10.1002/pro.5560030609. [DOI] [PMC free article] [PubMed] [Google Scholar]
- 13.Eftink MR, Ramsay GD. Studies of the unfolding of an unstable mutant of staphylococcal nuclease: evidence for low temperature unfolding and compactness of the high temperature unfolded state. Proteins. 1997;28:227–240. [PubMed] [Google Scholar]
- 14.Lassalle MW, Yamada H, Akasaka K. The pressure-temperature free energy-landscape of staphylococcal nuclease monitored by (1)H NMR. J Mol Biol. 2000;298:293–302. doi: 10.1006/jmbi.2000.3659. [DOI] [PubMed] [Google Scholar]
- 15.Gittis AG, Stites WE, Lattman EE. The phase transition between a compact denatured state and a random coil state in staphylococcal nuclease is first-order. J Mol Biol. 1993;232:718–724. doi: 10.1006/jmbi.1993.1425. [DOI] [PubMed] [Google Scholar]
- 16.Baskakov IV, Bolen DW. Monitoring the sizes of denatured ensembles of staphylococcal nuclease proteins: implications regarding m values, intermediates, and thermodynamics. Biochemistry. 1998;37:18010–18017. doi: 10.1021/bi981849j. [DOI] [PubMed] [Google Scholar]
- 17.Yang M, Liu D, Bolen DW. The peculiar nature of the guanidine hydrochloride-induced two-state denaturation of staphylococcal nuclease: a calorimetric study. Biochemistry. 1999;38:11216–11222. doi: 10.1021/bi9909400. [DOI] [PubMed] [Google Scholar]
- 18.Dill KA, Shortle D. Denatured states of proteins. Annu Rev Biochem. 1991;60:795–825. doi: 10.1146/annurev.bi.60.070191.004051. [DOI] [PubMed] [Google Scholar]
- 19.Wrabl J, Shortle D. A model of the changes in denatured state structure underlying m value effects in staphylococcal nuclease. Nat Struct Biol. 1999;6:876–883. doi: 10.1038/12338. [DOI] [PubMed] [Google Scholar]
- 20.Carra JH, Privalov PL. Thermodynamics of denaturation of staphylococcal nuclease mutants: an intermediate state in protein folding. Faseb J. 1996;10:67–74. doi: 10.1096/fasebj.10.1.8566550. [DOI] [PubMed] [Google Scholar]
- 21.Wong CY, Eftink MR. Incorporation of tryptophan analogues into staphylococcal nuclease: stability toward thermal and guanidine-HCl induced unfolding. Biochemistry. 1998;37:8947–8953. doi: 10.1021/bi971863g. [DOI] [PubMed] [Google Scholar]
- 22.Maki K, Cheng H, Dolgikh DA, Shastry MC, Roder H. Early events during folding of wild-type staphylococcal nuclease and a single-tryptophan variant studied by ultrarapid mixing. J Mol Biol. 2004;338:383–400. doi: 10.1016/j.jmb.2004.02.044. [DOI] [PubMed] [Google Scholar]
- 23.Maki K, Ikura T, Hayano T, Takahashi N, Kuwajima K. Effects of proline mutations on the folding of staphylococcal nuclease. Biochemistry. 1999;38:2213–2223. doi: 10.1021/bi981962+. [DOI] [PubMed] [Google Scholar]
Associated Data
This section collects any data citations, data availability statements, or supplementary materials included in this article.


