Figure 5.
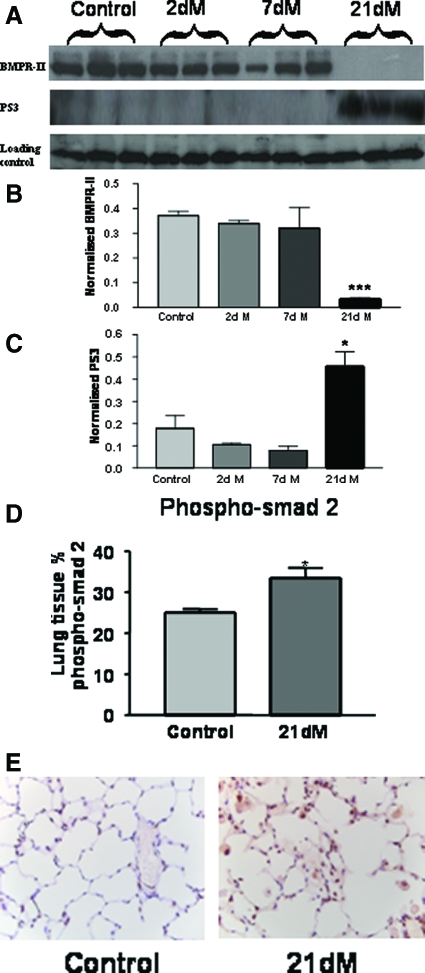
A: Changes in the expression of bone morphogenetic protein (BMPR-II) and phosphorylated Smad 3 (PS3) in the lungs of MCT-treated rats was assessed by immunoblotting (dM indicates days of MCT treatment). B and C: Quantification of immunoblotting for BMPR-II (B) and PS3 (C). The data shown are the mean density of the appropriate band ± SEM. *P < 0.05, ***P < 0.001 (Student’s t-test) compared with the respective control time point. D: Quantification of the expression of phosphorylated Smad 2 in the lung by immunohistochemistry. The data plotted are the mean area ± SEM of positive stained tissue expressed as a percentage of the total parenchymal area. *P < 0.05 (Student’s t-test) compared with control lung tissue area. E: Representative pictures of immunohistochemistry in lung tissue for phospho-Smad 2, brown indicates phospho-Smad 2 expression. Original magnifications, ×40.

