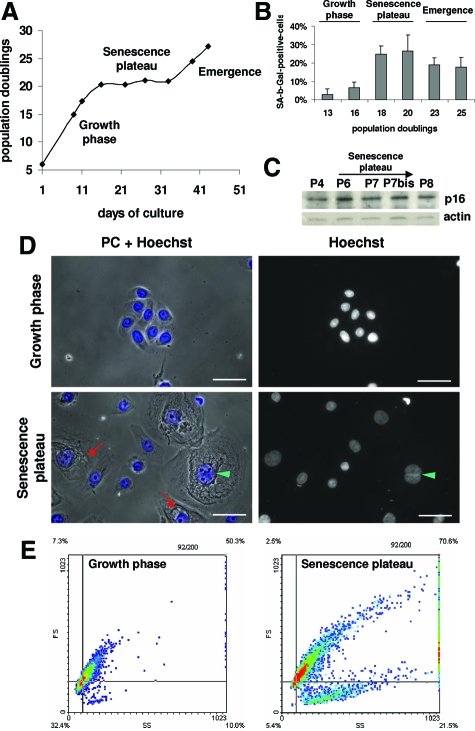
Figure 1.
Growth curve and characteristics of young, senescent, and dying keratinocytes. A: NHEK growth curve under standard conditions. B: SA-β-Gal assays. SA-β-Gal-positive cells in each phase were counted among about a thousand cells in at least five microscopic fields. Results are given as means ±SD of all field counts. The percentages at 18 and 20 PD are statistically different from those at 13 PD (P = 6 × 10⁻⁷ and P = 4 × 10⁻¹⁰), and the percentages at 23 and 25 PD are statistically different from those at 20 PD (P = 5 × 10−05 and P = 3 × 10−05). C: Western-blot analysis of the CKI p16INK4 level in total cell extracts. Actin was used as a loading control. The quantification of the film is given in supplemental Figure S1 at http://ajp. amjpathol.org. D: Cells during the exponential growth phase and at the senescence plateau were stained with Hoechst and observed under phase contrast and by epifluorescence microscopy. Senescent keratinocytes display vacuole-like structures of different sizes generally close to the nucleus (red arrows); they are often binucleated (green arrowhead). Scale bars = 20 μm. E: Flow cytometry analysis of the side-scatter (X) and forward-scatter (Y) factors, ie, granularity and size respectively, of NHEKs during the exponential growth phase and at the senescence plateau. The colors represent the point densities. The two cursors help to see that at the senescent growth plateau the overall population shifts in size and granularity and becomes very heterogeneous. A subpopulation of cells of very low size but high granularity, probably corpses, appears at the senescence plateau. The results from (A) to (E) are representative of different experiments performed with cells from six different donors.

