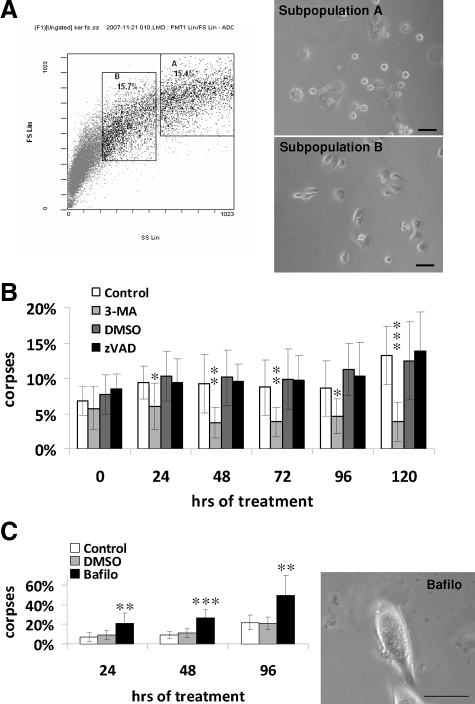
Figure 5.
Inhibition of autophagy, but not of apoptosis, delays senescent-cell death. A: NHEKs at the senescence plateau were analyzed by flow cytometry according to their forward-scatter (Y) and side-scatter (X) factor values. Two subpopulations were sorted; subpopulation A comprised the 15% of the cells with the highest forward and side scatter factor values, and subpopulation B with the next-highest scatter-factor values. Sorted cells were plated in 12-well plates at 20,000 cells per well and observed 24 hours later under a phase contrast microscope. Many non-plated cells were observed in subpopulation A, indicating that it is enriched in dying cells. Therefore subpopulation B, less engaged in the death pathway, was chosen for the experiment. B: Cells of subpopulation B were continuously treated with 3-MA at 5 mmol/L or with its diluent H2O as a control or with z-VAD at 20 μmol/L or its diluent DMSO. The number of typical corpses with a refringent central area was counted every day under the microscope. The results are means ± SD of counts in 5 random microscopic fields of each well, each condition being duplicated. C: Cells of subpopulation B were treated every 48 hours with 5 nmol/L bafilomycin A1 or its diluent DMSO. The number of corpses was counted as above. The photograph represents the morphology of bafilomycin-treated cells after 96 hours of treatment. Note the presence of a big central area full of very dense, granular material. P values were calculated with the t-test. *P < 0.05, **P < 0.005, and ***P < 0.0005. Those indicated are between 3-MA and control and between bafilomycin and dimenthyl sulfoxide. The other differences are non-significant. Scale bars: 50 μm in (A); 40 μm in (C).

