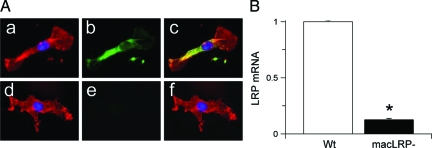
Figure 2.
Microglial LRP1 is effectively deleted in macLRP− mice. A: Representative micrograph of confocal microscopy analysis of microglial cultures from wild-type (a–c) and macLRP− mice (d–f). Blue is DAPI, red is Mac-1, and green is LRP. c and f correspond to merged images. B: Quantitative RT-PCR analysis in microglial cultures from wild-type (Wt, white bar) and macLRP− (black bar) mice. n = 4. Bars denote SD. *P < 0.001. Original magnifications, ×100.

