Figure 2.
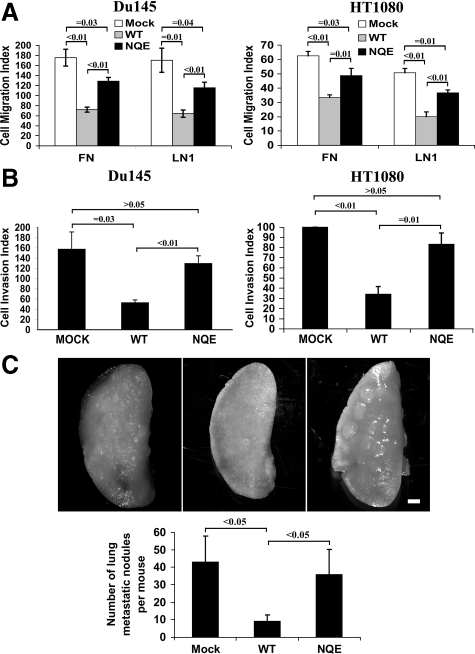
NQE mutation disrupts CD82-mediated suppression of cell migration and invasion. A: Cell migration of Du145 and HT1080 transfectants was analyzed using Transwell inserts coated with FN (10 μg/ml) or LN1 (10 μg/ml). Cells that migrated onto the lower surface were fixed, stained, and then counted. Data are the average cell numbers of five (for Du145 cells) or eight (for HT1080 cells) randomly selected microscopic fields at the magnification ×40, and the results represent the mean ± SE of three (for Du145 cells) or four (for HT1080 cells) independent experiments. For the migration of Du145 transfectants on FN, P value is <0.01 between Mock and wild-type (WT), <0.01 between wild-type and NQE mutant, and = 0.03 between Mock and NQE. For the migration of Du145 transfectants on LN1, P value = 0.01 between Mock and wild-type, <0.01 between wild-type and NQE mutant, and = 0.04 between Mock and NQE. For the migration of HT1080 transfectants on FN, P value is <0.01 between Mock and wild-type, = 0.01 between wild-type and NQE mutant, and = 0.03 between Mock and NQE. For the migration of HT1080 transfectants on LN1, P value <0.01 between Mock and wild-type, <0.01 between wild-type and NQE mutant, and = 0.01 between Mock and NQE. B: Cell invasion of Du145 and HT1080 transfectants was determined using Biocoat Matrigel Invasion chambers (BD). The inserts were primed according to the manufacturer’s directions. Cells (2.5 × 10³) were placed in the upper chamber. After incubation for 22 to 24 hours, cells that invaded through Matrigel onto the lower surface of the filter were fixed, stained, and counted. Results obtained from three (for Du145 cells) or four (for HT1080 cells) individual experiments and represent the average invaded cell number of five (for Du145 cells) or eight (for HT1080 cells) microscopic fields. For Du145 transfectants, P value = 0.03 between Mock and wild-type, <0.01 between wild-type and NQE mutant, and >0.05 between Mock and NQE. For HT1080 transfectants, P value <0.01 between Mock and wild-type, = 0.01 between wild-type and NQE mutant, and >0.1 between Mock and NQE. C: Lung metastasis of HT1080 transfectants was analyzed in the murine experimental metastasis model as described in “Materials and Methods.” The lungs of inoculated mice were dissected and photographed. The image of a single lung lobe from each group is shown. The macrometastatic foci (>0.3 mm) on the lung surface were counted under dissecting microscope. The P value <0.05 between Mock and wild-type and between wild-type and NQE mutant and >0.05 between Mock and NQE mutant; for each group, n = 10. Scale bar = 1 mm.

