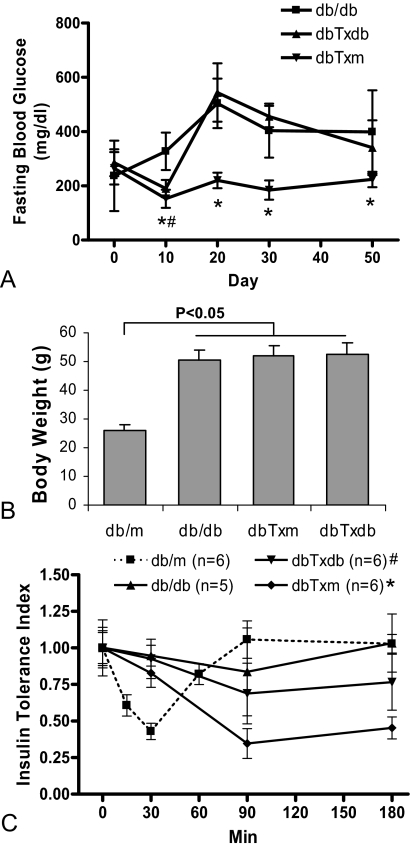
Figure 2.
Fasting blood glucose level and insulin tolerance test. A: Improvement of fasting glucose level was documented in the dbTxm group following each infusion of the BMDC, compared with untreated db/db mice. In the dbTxdb group, improvement of fasting glucose level was documented only after the first infusion. *#P < 0.05 vs db/db. B: Body weight measurement indicated that the diabetic mice were all obese compared with db/m, but showed no difference between db/db, dbTxm, and dbTxdb groups. C: Insulin tolerance index in BM transplanted group showed significant improvement in insulin sensitivity over db/db mice, especially in the dbTxm group. *P < 0.01 compared with db/db at 90 and 180 minutes, P < 0.05 compared with dbTxdb group; #P < 0.05 compared with db/db at 90 and 180 minutes (n = 6 for db/m, dbTxm, and dbTxdb groups, n = 5 for db/db).

