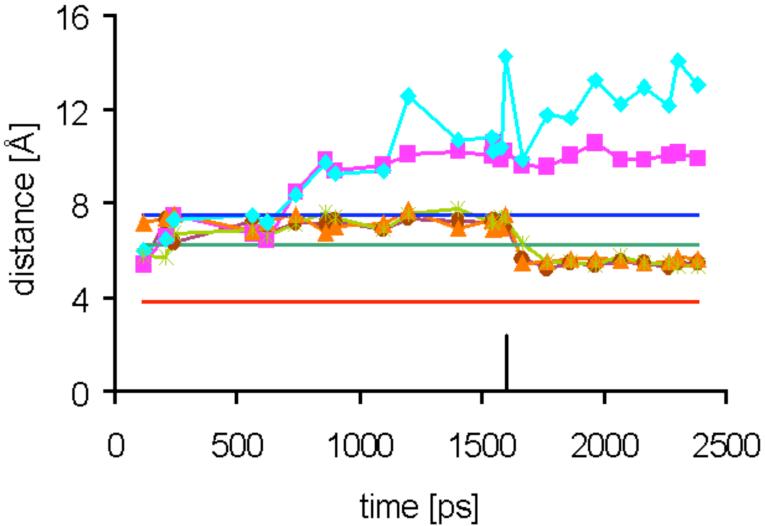
Figure 8.
Time evolution of distances between the phosphorus atom of 16 and NZ of Lys92 in the five ligand binding sites A-E (colors) of the pentamer (see Figure 7 for the labeling of the binding sites) during molecular dynamics at 300 K for structure II. The restraints to all REDOR residues (excluding Lys92) were applied at the start. Lys92 restraints in three binding sites (for Lys A92, Lys C92 and Lys E92) were applied at about 1.6 ns (see black marker). The distances LysB92-P and LysD92-P (purple and light blue, respectively) remained unrestrained during the entire dynamics run. Experimental x-ray (for the lumazine synthase complex with 15) and REDOR distances (for the lumazine synthase complexes of 15 and 16) are shown as straight lines colored dark blue, green and red, respectively.

