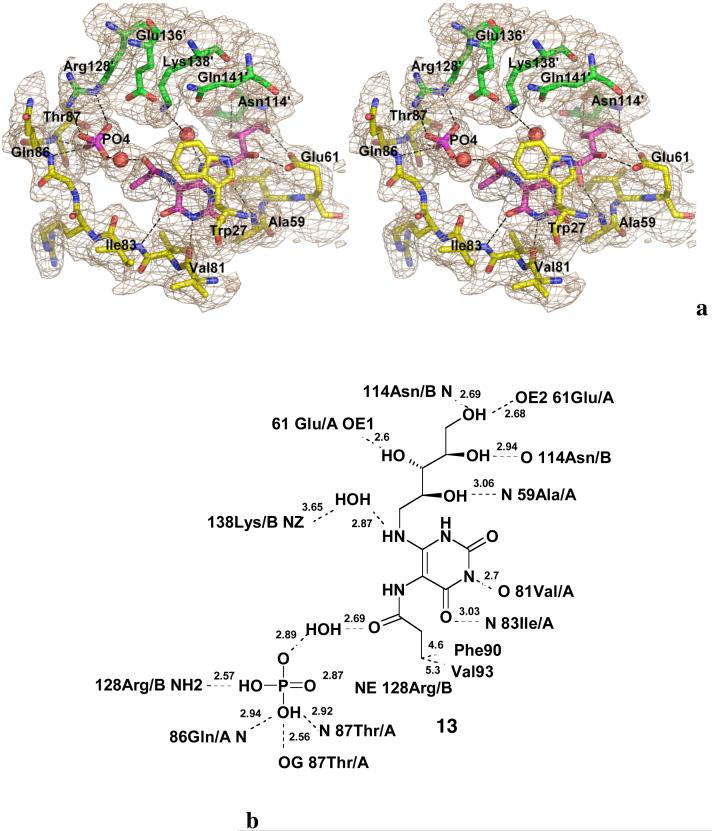
Figure 1.
Stereodiagram of the 2|Fo|-|Fc| electron density map (σ =1.5) around the active site of M. tuberculosis lumazine synthase in complex with inhibitor 13 and a phosphate ion (magenta) (PDB ID 2VI5) (a), and the respective schematic drawings of the interactions between the enzyme and the ligand (b). Red spheres indicate water molecules. The carbon atoms of the residues of different subunits are shown in green and in yellow, oxygen atoms are in red, and nitrogen atoms are in blue (25).


