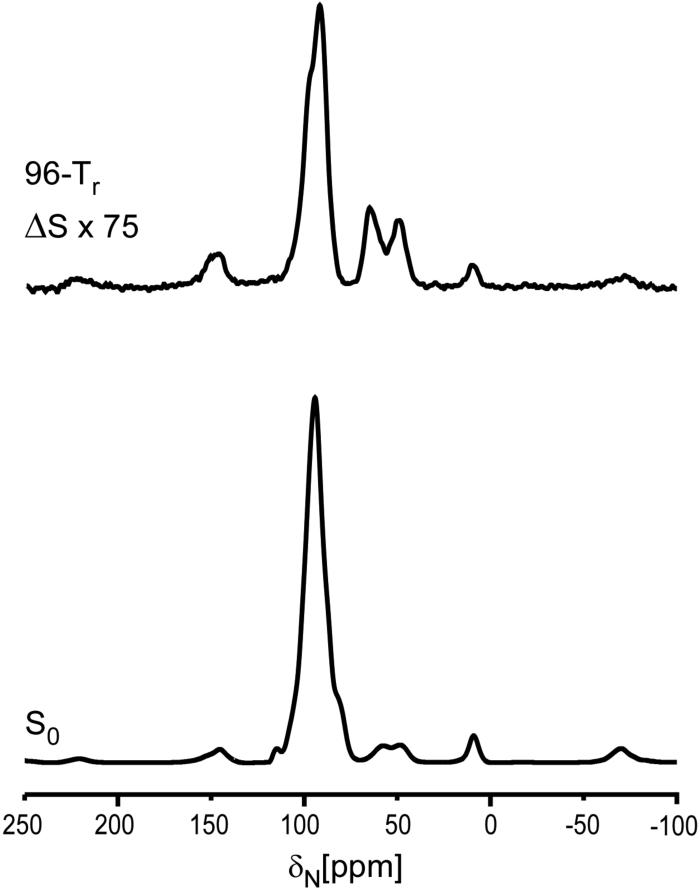
Figure 3.
30-MHz 15N{31P} REDOR spectra of the 5-carbon-linker 15 complex after 19.2 ms of dipolar evolution. The REDOR difference is shown at the top of the figure, and the full echo at the bottom. The sample contained 110 mg of protein. The scan count was 262,144 and the magic angle spinning rate was 5000 Hz.

