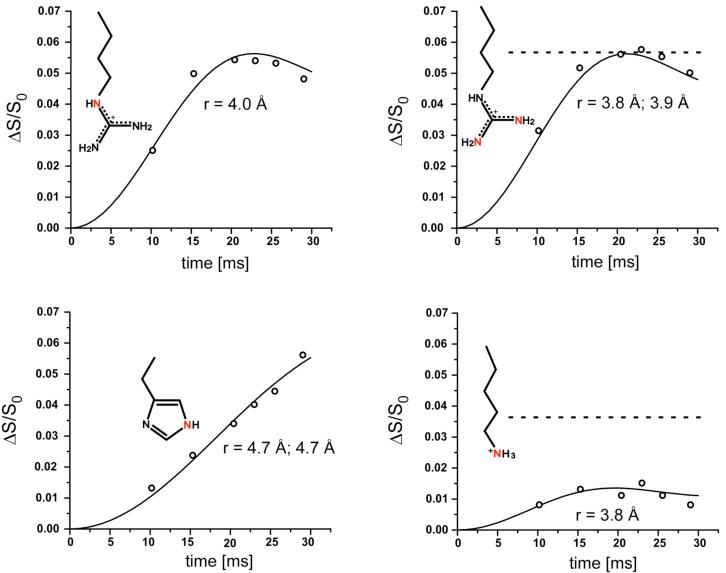
Figure 6.
Experimental (circles) and calculated (solid lines) 15N{31P} REDOR dephasing (Δ/S0) as a function of dipolar evolution time for sidechain nitrogens (highlighted in red) of S. cerevisiae lumazine synthase complexed with the 6-carbon-linker phosphonate 16. The experimental dephasing was the result of the accumulation of 1,613,824 scans for both S and S0 REDOR spectra. The dashed line for the upper right plot indicates that the maximum dephasing of the arginine peak is 0.055, which corresponds to 38% occupancy of the lumazine synthase active sites. The dashed line for the lower right plot shows that the corresponding expected maximum dephasing of the lysine peak is 0.034 (from 0.38/11). The observed dephasing maximum of the lysine peak is 0.013.

