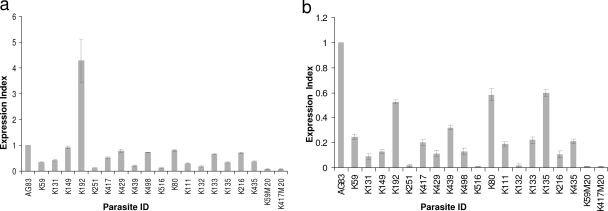
FIG. 1.
Expression of LdMT and LdRos3 in different field isolates. (a) Real-time reverse transcription-PCR expression analysis of an L. donovani MIL transporter (LdMT). The graph shows the expression index, defined as ratios of gene expression relative to that of strain LdAG83. (b) Real-time reverse transcription-PCR expression analysis of an L. donovani MIL transporter (LdRos3). The graph shows the expression index, defined as ratios of gene expression relative to that of strain LdAG83. Data represent the means of the results of three independent experiments.

