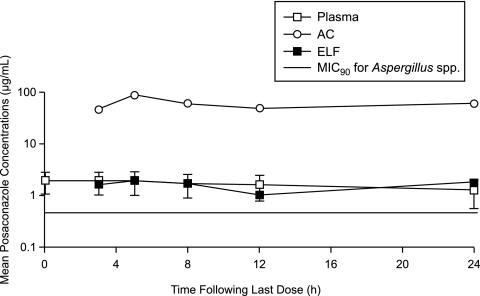
FIG. 1.
Mean POS concentrations in plasma, ELF, and ACs. Shown are concentration-time profiles for POS on day 8 after healthy subjects received POS (400 mg; 40-mg/ml oral suspension) every 12 h with food (10 min after eating a high-fat meal) for a total of 14 doses. Note that only the plasma data has error bars (± SD), as the data were obtained from multiple subjects at the same time. The ELF and AC data were obtained as one data value per subject. The MIC90 value for Aspergillus spp. was obtained from the recent literature (19).

