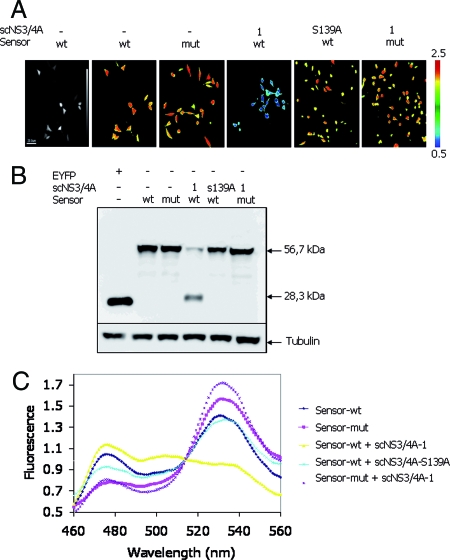
FIG. 2.
Cleavage of fluorescent sensor mediated by HCV scNS3/4APt1 (scNS3/4A-1) as determined by FRET imaging in live cells, Western blot, and fluorimetry of cell extracts. (A) FRET imaging of live cells. Fluorescence (leftmost panel) and pseudocolored ratio images (FRET channel/ECFP donor channel, with pseudocolor scale shown on the right) of HeLa cells 24 h after transfection are shown. (B) Western blot of cytosolic extracts of HeLa cells transfected with the indicated expression plasmids. EYFP was used to monitor the size of a free fluorescent protein. The bands corresponding to the full-size fusion protein (56.7 kDa) and its cleavage products (28.3 kDa) are indicated. (C) Emission spectra of cytosolic extracts show that the sensor with CSwt coexpressed with scNS3/4APt1 had a negligible FRET rate (decrease in emission peak at 531 nm). Neither the CSmut sensor nor mutated protease (NS3/4A-S139A) displayed a decrease in FRET. +, present; −, absent.

