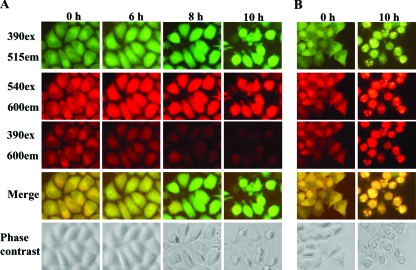
FIG. 1.
FRET image analysis. HeLa-G3CwtR (A) and HeLa-G3CmutR (B) cells grown in a 24-well dish were inoculated with EV71 stock at an MOI of 3 for 10 h. At the indicated time points, the cells were visualized with a fluorescence microscope (Nikon TE200) at 390ex/515em for GFP2, 540ex/600em for DsRed2, and 390ex/600em for FRET. The images from the 390ex/515em and 390ex/600em filter sets were merged. The cells were also observed with a phase-contrast microscope.

